
Eric Sepanek
SBC Founder
Eric Sepanek is the founder of Scottsdale Bullion & Coin, established in 2011. With extensive experience in the precious metals industry, he is dedicated to educating Americans on the wealth preservation power of gold and silver.

Nothing shines brighter than silver.[1] Perhaps this is one reason why the precious metal is as essential to investors as it is to industry.[2][3]
As one of the seven metals of antiquity, silver has been valuable in societies for centuries. Archaeologists discovered silver hoop earrings dating back 3,200 years in Israel.[4] In French, silver shares the same name as “money,” “argent,” and, in Roman, the word “banker,” “argentarius.”[5] Supreme over all other metals when it comes to transferring heat and electricity and reflecting light, it’s no wonder the white metal has and continues to play a vital role in forging the modern world.[6]
Surpassing gold in applications outside of investment, silver has a complex supply and demand equation, one of the primary factors influencing silver prices.[7] Thus, any serious silver investor will want to monitor fluctuations in the global consumption and production of the white metal.
Learn more about the traditional drivers of supply and demand for silver, the state of the market in 2018, and the outlook for 2019 and beyond in this article.
Traditional Supply and Demand Factors for Silver
Boasting brilliant luster and unparalleled physical and chemical properties, silver straddles the spheres of precious metals investing, retail, and industry. Considered a precious metal for its value and rarity, supply of silver is limited, with mining and scrap serving as the two primary sources replenishing markets.
Silver Demand Sectors
Silver Investment
Civilizations have coveted silver for 6,000 years. From the ancient Greeks’ silver stater to the British pound sterling, the white metal has been used as a currency since 700 B.C.
Although many nations have traded in their silver and gold standards for fiat currency systems today, investors hedge against economic and financial market risk and geopolitical uncertainty by keeping silver in their investment portfolios and precious metals IRAs.[8]
Spotlight: The Impact of Silver Investing on Supply
Silver continues to play an important part in investor portfolio diversification. Standard one-on-one economic theory suggests a balanced portfolio should consist of at least 5-10% precious metals, in order to counter equity boom and bust cycles…–the Silver Institute and Thomson Reuters, World Silver Survey 2019
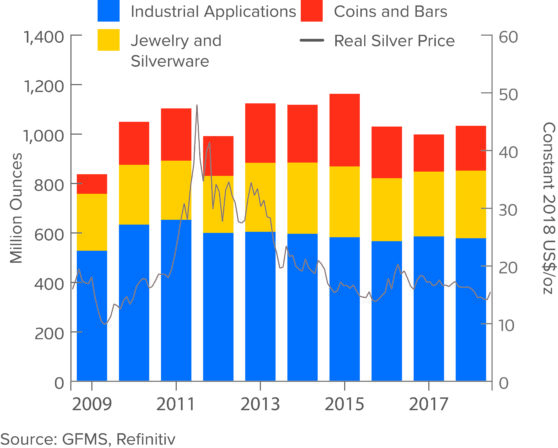
Over the last decade, silver investing has accounted for a significant amount of annual silver demand: one-fifth of total silver supply during that time went to investors in the form of silver coins and bars. Silver investing peaked immediately after the last financial crisis, with physical silver purchases utilizing 22 percent of annual supply from 2013 to 2014 and 28 percent in 2015.[9]
With economists predicting that the next financial crisis could be worse than 2008 and another recession within the next couple years, expect demand from silver investing to surge again soon.
Silver Jewelry and Silverware
Whether to add sparkle to a neckline or the dinner table, silver has been used for adornment since ancient times.[10]
Since pure (.999) silver is too soft for making jewelry and cutlery, harder metals, such as copper, are added to create sterling silver. Consisting of 92.5 percent silver and 7.5 percent copper, sterling silver is the standard for bracelets, earrings, and necklaces, as well as tableware.[11][12]
Industrial Silver Applications
Silver’s properties are as valuable and diverse as its forms. The metal possesses unrivaled thermal and electrical conductivity; malleability and ductility; photosensitivity; and antimicrobial strength. It can be ground into a powder and softened into a paste; flattened into printable sheets; shaved into flakes and transformed into salt; suspended as a colloid; and used as a catalyst.[13]
Uses of Silver in Industry
- Photography
- Renewable Energy
- Water Purification
- Technological Devices
- Electronics
- Auto Manufacturing
- Catalysts
- Medicine
- Brazing and Soldering
- Bearings[14]
- Wearable Technologies
Industry is so reliant on silver that approximately 60 percent of demand derives from this sector.[15] With the expansion of the middle class in the emerging market economies of the East, demand for electronics, medical products, appliances and other goods containing silver is set to explode in the coming years.[16]
Silver Supply Sources
Mining and the recycling of silver scrap metal are the two main sources of silver today.
Silver Mining
Since it was first mined in Anatolia, now Turkey, in 3,000 BCE, silver production has fueled the growth of empires from ancient Greece to post-colonial America.[17]
To date, 1,740,000 metric tons of silver have been discovered, enough to make a cube 55 meters on one side. Globally, silver reserves total 530,000 MT.[18]
Mexico, Peru, and China were the top three silver producing countries in 2018, reports the Silver Institute. Few mines are dedicated specifically to silver, with less than a third of global silver supply deriving from primary producers.[19] The majority of silver produced is the byproduct of copper, zinc, and lead mining.[20]
Silver Recycling
Recycling silver from scrap, such as old silver jewelry, watches, and tableware, is another significant source of the white metal. Levels of recycling can be highly influenced by silver prices, as consumers and suppliers tend to be more motivated to turn in their old items when returns are favorable.[21]
World Silver Supply and Demand 2018
The silver supply and demand equation in 2018 supports higher prices for the precious metal in the near future: the total supply fell 3 percent while physical demand for silver increased 4 percent, according to the World Silver Survey 2019 by the Silver Institute and Thomson Reuters.[22]
Below is a closer look at the factors that shaped silver supply and demand last year.
Silver Supply and Demand Chart 2018
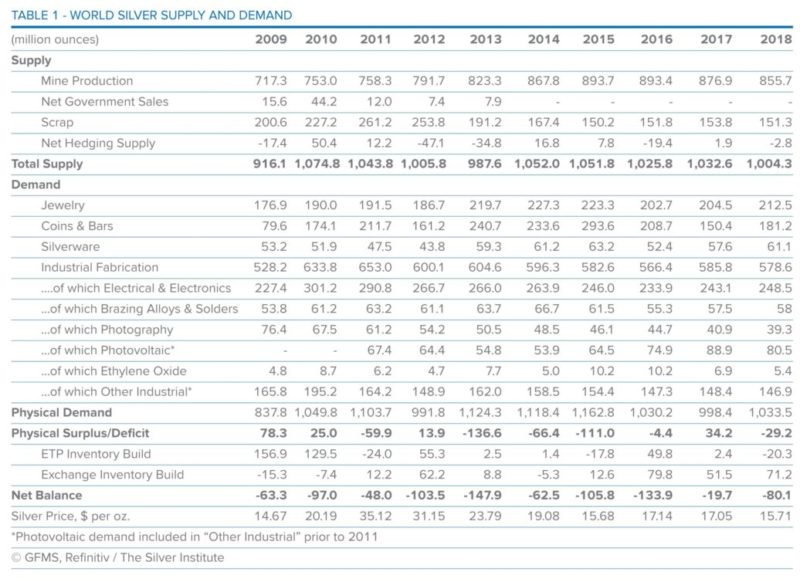
Total Silver Supply 2018
Declines in mine and scrap output constricted the supply of silver by 3 percent in 2018.
Silver Mine Supply 2018
Court-ordered mine suspensions in major lead and zinc operations in Guatemala; fires in Canada’s top producer’s smelting facilities; and unexpected maintenance issues in U.S. mining operations contributed to a 2 percent decrease in silver mine output in 2018. A total of 855.7 Moz came from silver mining. It was the third consecutive year of declines.
Silver Scrap Supply
Last year’s dip in the price of silver deterred people in many countries from recycling their old silver jewelry and tableware. North America was the outlier thanks to the silver industrial waste generated by the strong U.S. economy. Scrap accounted for 151.3 Moz, a 2 percent drop from 2017.
Global Scrap Silver Supply
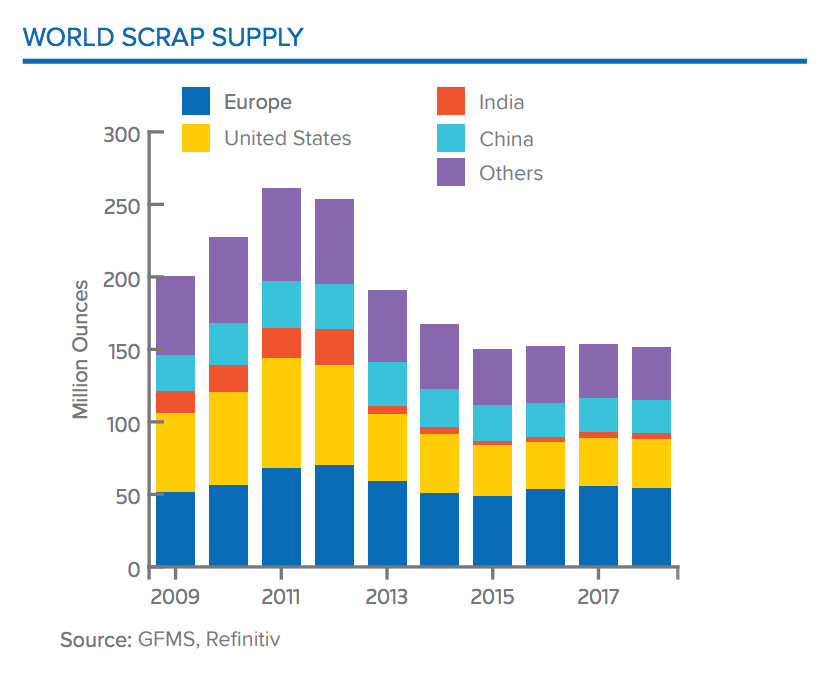
Source: The Silver Institute
Total Silver Demand 2018
Amid a slowing global economy and escalating economic and political problems, demand for physical silver jumped 4 percent in 2018.
Silver Demand Sectors 2018
Silver Investing Demand
After pulling back for two consecutive years, global physical silver buying jumped 5 percent to 161.0 Moz in 2018. Much of the spike in demand was attributable to a stellar Indian investment climate, in which physical silver purchases soared by 53 percent. India dominated the silver bullion trade, with imports increasing 36 percent, the highest level since 2015. Healthy growth in demand for physical silver was also recorded in South Korea.
The story for silver coin buying was especially favorable to higher prices in 2019. After dipping significantly in the first quarter of 2018 in North America and Europe, demand increased 25 percent and 22 percent respectively. Globally, silver coin purchases rose 26 percent everywhere, expect in Japan.
Factors underlying the shift in investor sentiment in North America included a weakening U.S. dollar; a generally uncertain domestic political environment, reflected in frequent and economically detrimental government shutdowns; and the expectation that the Federal Reserve would pause its cycle of interest rate hikes in 2019.
Silver Demand from Jewelry and Silverware
Silver Jewelry
Worldwide silver jewelry fabrication increased 4 percent to 212.5 Moz in 2018. Higher gold prices and greater retail outlet offerings was behind the 16 percent spike in Indian jewelry fabrication, while the continued expansion of the industry in North America contributed to a 4 percent rise, with the U.S. notching a 7 percent increase.
Although many fabricators of silver jewelry noted a deceleration in growth, they overall thought demand is still expanding. In fact, a recent survey of silver retailers indicated that the white metal is considered the ultimate self-purchase for females, enjoying the best inventory turnover rate as a result.
Silverware
Increases were also reported in silverware fabrication, which saw a global rise of 6 percent to the three-year high of 61.1 Moz. Ten percent of the increase in demand was attributable to Indian production. The nation was also a top consumer of silverware, accounting for more than two-thirds of global consumption.
Other countries to record a rise in silverware fabrication included Europe (2 percent), Turkey (20 percent), and Italy (3 percent). Production hit a nine-year high in Israel, rising 6 percent.
Industrial Silver Demand
A dip of 1 percent in industrial silver demand last year signaled slowing growth in the global economy, indicated the Silver Institute and Thomson Reuters. Contrasting sharply with the 4 percent increase in industrial silver demand in 2017, the pullback reflected the sluggish growth in the world’s second largest economy, China, of 6.6 percent, the lowest level the country has seen in 28 years. Contraction in the Eurozone sent production plummeting at the fastest pace since the last financial crisis.
The U.S. was the only outlier, where industrial output hit an eight-year high and GDP grew 2.9 percent. However, with economists forecasting the next recession to hit soon, that may have been more of an indicator of an overheating economy than real growth.
Industrial Demand 2018 Statistics
Source: The Silver Institute
Solar Photovoltaic Demand
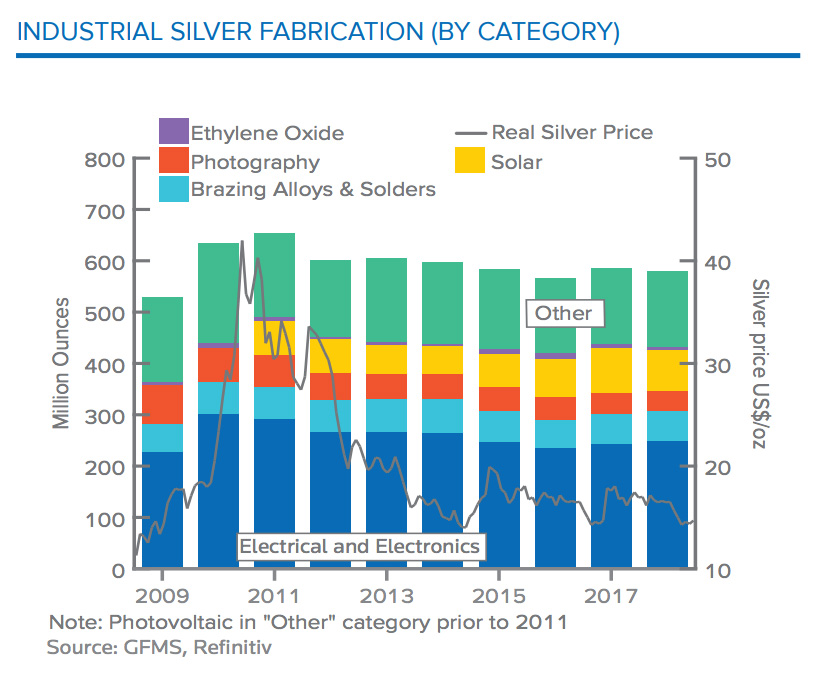
Whereas demand for silver in the photovoltaics industry shot up 19 percent in 2017 due to strong uptake in Chinese homes, it declined 9 percent as manufacturers ramped up silver thrifting to cut costs in 2018. However, with governments in numerous countries offering solar energy incentives, demand for silver in the PV sector is expected to stay robust in the coming years.
Electrical and Electronics Sector
Approximately 41 percent of the silver used in industrial applications was consumed in the electrical and electronics sector last year, which notched a 2 percent increase.
The use of silver in smartphones pulled back due to a slowing Chinese economy and U.S. tariffs on Chinese electronics imports. This trend is expected to shift, though, as screen sizes become larger and demand for high-end devices increases.
Brazing Alloys and Solders
A modest gain of 1 percent was recorded for the silver brazing alloys and solders sector. A strong electronics industry drove demand prior to the start of the U.S.-China trade war.
Automotive Manufacturing
A move toward electrification in the automotive industry is becoming another important source of demand for silver. Boasting excellent electric conductivity, silver is employed in and around the electric powertrains in hybrid ICE cars and electric vehicles. The white metal also factors into the electrical connections in most vehicles, batteries, and solar cells used in energy independent vehicles. Overall, the automotive industry consumed 51.8 Moz of silver in 2018, a 4 percent increase from the year prior.
Automotive Sector Silver Demand
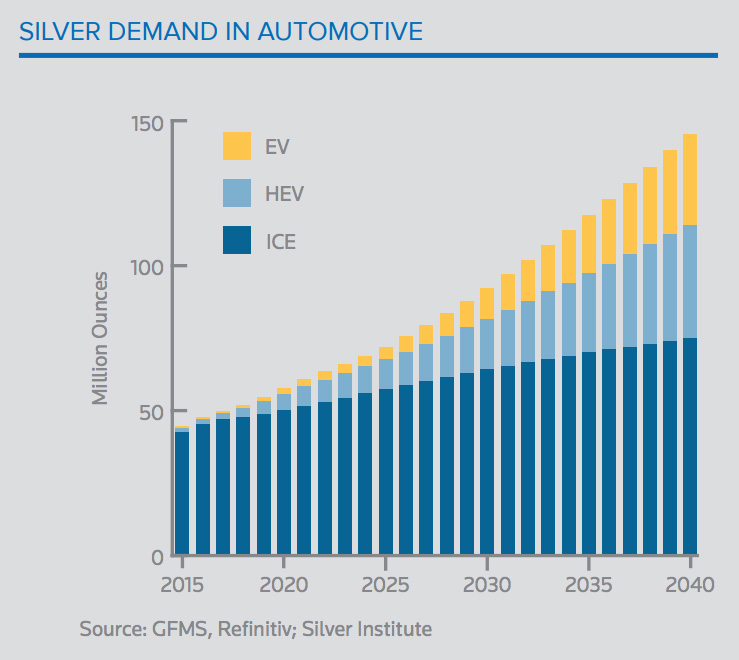
Source: The Silver Institute
Ethylene Oxide (EO)
Detergents, textiles, plastic bottles, and cosmetics—all of these rely on ethylene oxide, and this critical chemical intermediate can’t be produced without silver serving as a catalyst. Improvements in the standard of living in emerging economies has been driving demand for EO in recent years; however, fewer new plants are being built, so the need for silver in this sector declined by 26 percent in 2018. Replacement demand remained strong, though, increasing 22 percent.
Photography
The shift to digital technologies has contributed to the steep decline in the use of silver in photography of 80 percent since 1999. In 2018, demand from this sector decreased another 4 percent to an estimated 39.3 Moz. There is one bright spot for this sector, however, as the use of traditional photographic film and paper have been regaining popularity among younger generations of professional photographers.
Gold-Silver Ratio 2018-2019
The gold:silver ratio can rally in the face of a crisis… It is arguable that in anticipation of a crisis the market could see a ratio of above 80.–the Silver Institute and Thomson Reuters, World Silver Survey 201[23]
If that’s the case, then the financial market crash and economic downturn economists have been predicting could be just around the corner. The gold-silver ratio represents the amount of silver necessary to purchase one ounce of gold. It hovered above 80 for most of 2018 and all of 2019. Half way through 2019, the ratio is flirting above 90!
Gold-Silver Ratio (July 5, 2019)
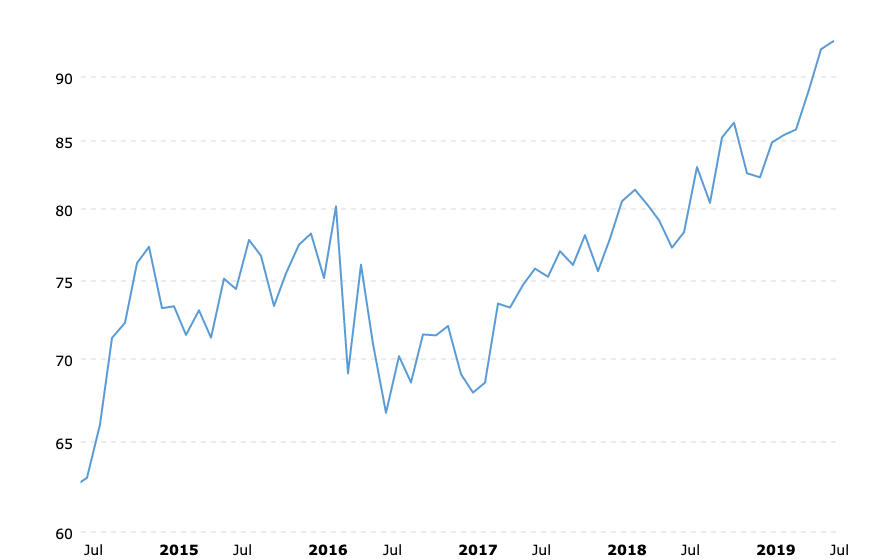
Chart source: Macrotrends.net
Not since the last financial crisis has the gold-silver ratio remained so high. However, once markets and the U.S. dollar start declining, silver prices can outperform gold prices. This was the case in 2018 when both equity markets and the dollar experienced sharp losses. What does this mean to investors? Take advantage of bargain silver prices when the ratio peaks right before the next financial or economic crash—NOW.
Silver Supply and Demand Forecast 2019 and Beyond
A shift in domestic and global economic conditions is already creating a supportive environment for silver demand and prices, one that we can expect to see for the remainder of 2019 and beyond.
Specifically, the stock market volatility that has plagued markets intermittently may return and stay; the record-long economic expansion is expected to peter out; and political uncertainly could potentially escalate into crises around the world.
Here’s a look at what the Silver Institute is predicting for silver supply and demand in in 2019.
Silver Supply 2019
Output from silver mines is forecast to continue falling this year, while scrap supply should rebound.
Silver Mine Production 2019
Production of silver from primary and byproduct operations, except zinc and lead ones, are predicted to decrease. Silver recovered from zinc, lead, and gold operations is set to rise slightly. Overall, a 2 percent drop in silver mine production is expected this year.
Silver Scrap Supply 2019
Jewelry recycling and industrial silver scrap should contribute to a healthy uptick in scrap supply in 2019.
Silver Demand 2019
Overall, silver’s traditional demand drivers should see a spike in usage of the white metal this year.
Silver Investing Demand
Savvy investors are certainly planning for a period of market contraction: they bought 12 percent more American Silver Eagle coins in January 2019 compared to the same month in 2018, reported the U.S. Mint. By February 21, 2019, the Mint sold out of American Eagle 1-ounce silver bullion coins and had to suspend sales.[24]
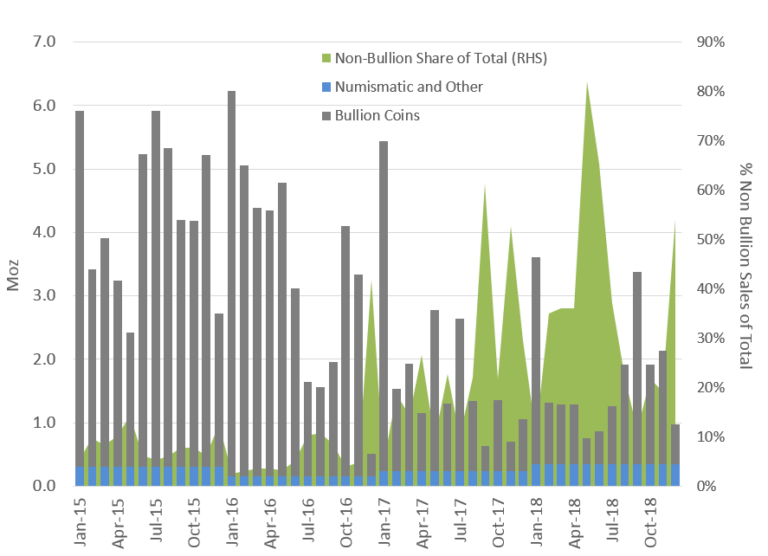
In 2018, demand for non-bullion silver coins increased for the second year in a row by 42 percent. Total physical demand is forecast to jump by 5 percent in 2019.
U.S. Mint Non-Bullion Silver Coin Demand Soars
Silver Jewelry Demand 2019
Solid growth, particularly in Thailand, is expected to propel silver demand this year. Silver should continue to give gold some healthy competition in the U.S., especially with the female demographic. The global market will also likely gravitate toward silver adornment thanks to the wide range of design choices, quality, and prices.
Industrial Demand for Silver 2019
Most sectors of industrial silver demand are expected to notch reasonable growth this year, particularly electrical applications; brazing alloys and solders; and automotive manufacturing. Despite a pullback in demand, photovoltaic (PV) demand should continue to expand as more and more countries move away from fossil fuels toward renewable sources.
Across these demand drivers, India will be the country to watch this year, as it’s predicted to be one of the largest purchasers of silver.
The Impact of Supply and Demand on Silver Prices
How will the supply and demand equation for silver in 2018 and 2019 influence silver prices in the near future?
Expect the price of silver to rise as demand continues to increase and supply constrict. The Silver Institute predicts an average silver price of $16.75 in 2019 due to stock market volatility.[25]
But, others in the industry expect even higher silver prices: $18, $20, and even $130!
Read our Silver Price Forecast 2019 for in-depth analysis of where prices for the white metal are heading.