

Eric Sepanek
SBC Founder
Eric Sepanek is the founder of Scottsdale Bullion & Coin, established in 2011. With extensive experience in the precious metals industry, he is dedicated to educating Americans on the wealth preservation power of gold and silver.

Steve Rand
General Manager / Sr. Precious Metals Advisor
Steve Rand is the General Manager and a Sr. Precious Metals Advisor at Scottsdale Bullion & Coin. He brings over 20 years of experience in the physical precious metals markets.

Add SBC on Google as a preferred source to see more market related news like this when you search.

On the surface, markets appear calm. In fact, stocks recorded 23 record highs halfway through the year. However, rumblings from some of the biggest names on Wall Street suggest that the apparent calm may be underestimating real risks.
In this week’s The Gold Spot Scottsdale Bullion & Coin Founder Eric Sepanek and Sr. Precious Metals Advisor Steve Rand peer under the hood of the roaring market, heed warnings from some of finance’s most respected voices, and examine why today’s seemingly resilient stock market may be more fragile than headline numbers suggest.
Jamie Dimon Isn’t Buying Stocks or Bonds Right Now
In a sit-down interview with CNBC, JPMorgan CEO Jamie Dimon revealed that he’s holding off on buying long-term bonds and broad equities due to underlying fiscal and geopolitical threats. In his eyes, “those risks are probably bigger than…people think.”
More specifically, Dimon warned that the U.S. government’s routine deficits could push demand for interest rates higher, rendering current bond yields less attractive.

At the same time, the banking head compared the artificial intelligence (AI) boom to the Internet bubble of the early 2000s, preferring to stay out of stocks due to their inflated valuations.
Crucially, Dimon believes the AI explosion is likely to bear fruit for the economy, but not without a significant correction. He compared these fiscal, economic, and geopolitical pressures to straws on a camel’s back, acknowledging that nobody knows which one will break the market.
Has the Stock Market Become Too Dependent on One Story?
In last week’s The Gold Spot, Scottsdale Bullion & Coin advisors looked at the growing AI bubble in the economy. After all, nearly half of the S&P 500’s total market value is comprised of AI-linked companies.
Even more alarmingly, removing AI from the picture altogether would put the stock market in the negative. This underscores how much is riding on a single technology. Some additional figures can offer more insight into the market’s risk landscape.
P/E Ratios at Historic Highs
A price-to-earnings ratio is a commonly cited metric for determining the health of a publicly traded company by comparing stock valuation to revenue. The S&P 500, which represents the top 500 most valuable companies, hit a P/E ratio of nearly 26x in June 2026. In other words, investors are paying about $26 for every $1 of expected annual earnings. This is around 32% higher than the market’s historical average P/E ratio of 19x.
Buffett Indicator (Market Cap-to-GDP)
The Buffett Indicator, popularized by legendary investor Warren Buffett, compares the stock market to the country’s gross domestic product. This metric helps compare equity values against real-world productivity. As of mid-July 2026, the Buffett Indicator stands at 234%, the highest point in recorded history. More plainly, investors are valuing companies at $2.34 for every $1 worth of goods and services the U.S. economy generates in a year.
It’s worth noting that these historically high valuations—and the extreme disconnect between earnings, GDP, and stock prices—don’t predict when markets will decline. Instead, these gauges point to a highly sensitive market with lower expected future returns, a smaller margin for error, and greater vulnerability to changing market forces.
Corporate Insider Selling Nears Two-Decade High
While valuation metrics can assess how overweight the stock market has become, insider activity offers a behind-the-scenes look at how the most informed and well-connected investors behave. This can provide a useful window into market sentiment and broader market behavior down the line.
Tellingly, corporate insiders shed $77.6 billion in stock investments in the first half of 2026, representing a 20% increase in selling compared with the same period last year, according to Bloomberg. Moreover, this rapid spike in stock offloading is the second-highest level of insider selling in over 20 years. Through H1 2026, insiders sold their shares at a ratio of 11 sellers to 1 buyer.

Meanwhile, investors continued pouring money into the stock market. U.S. listed ETFs attracted more than $1 trillion in net inflows during the first half of 2026, including roughly $680 billion directed toward equity ETFs.
Simply put, the investors with the closest view of the economy’s wealthiest companies have been actively reducing their exposure while everyday Americans expand their allocations.
Insider Selling Doesn’t Predict a Crash
Of course, insider selling doesn’t automatically correlate with an impending market crash. Whales can offload their shares for a variety of reasons, including diversification, taxes, and estate planning, to name a few.
However, investors are starting to notice a pattern emerging. Aggregate selling has reached unusually high levels among tech executives who are heavily involved in the AI industry. Plus, financial leaders and billionaire investors are warning of a potential correction. This confluence of market warnings and reactivity is enough to make investors pay attention.
Markets Look Calm Despite Growing Risks

Recently, the Wall Street Journal aptly described the stock market as a duck wading across a pond: looking calm and resolute above yet paddling vigorously below. This accurately describes an equities market that keeps setting all-time highs despite some uncertainty lingering beneath the surface.
The Volatility Index (VIX), which tracks the market’s expectations of volatility over the succeeding month, remains below levels typically seen before major downturns. CNN’s Fear & Greed Index, which tracks investor sentiment, has remained relatively stable over the past few months, though well within “Fear” territory.
The AI Boom Echoes Earlier Technology Bubbles
Artificial intelligence has the potential to reshape the global economy, much like the internet did decades ago. However, decades of market performance suggest that even transformative technologies can become surrounded by excessive investor enthusiasm before their full economic benefits materialize.
History offers several examples:
- Railroads revolutionized transportation in the 1800s but also fueled widespread speculation and overbuilding.
- Electrification transformed manufacturing and everyday life, yet many early companies failed to deliver lasting returns for investors.
- The early internet sent stock prices soaring before many ultimately collapsed in the dot-com crash, but the technology still transformed how people live and work.
Jamie Dimon believes artificial intelligence may follow a similar path. He has compared today’s AI boom to the early internet, arguing that while the technology is likely to have a profound long-term impact, investors may be expecting results on a faster timeline than reality allows.
The Fed Reserve Could Face Tougher Choices Than in 2008
Most people focus on the Federal Reserve’s mandate to keep inflation in check, but the central bank is also responsible for optimizing employment. These objectives often work in tandem, but today’s macroeconomic environment complicates the process considerably, even more than the 2008 global financial crisis.
The money supply has rapidly expanded, inflation remains far above the Fed’s 2% target, and U.S. national debt has climbed to nearly $40 trillion. Meanwhile, a higher-for-longer interest rate policy has pushed the debt interest burden beyond $1 trillion, further complicating fiscal management.
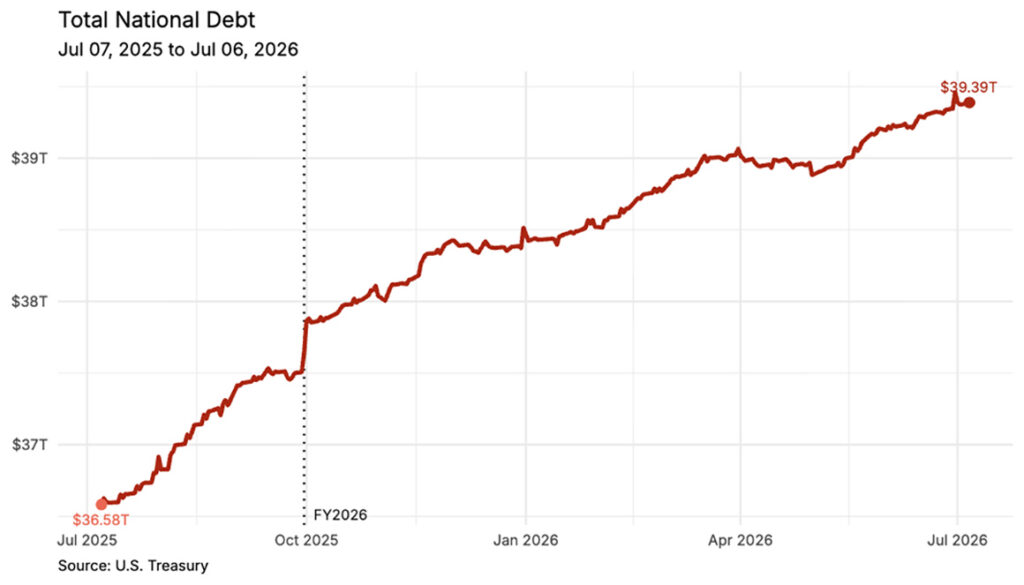
Via Congressman David Schweikert’s Daily Debt Monitor
Right now, policymakers are stuck between a rock and a hard place: cutting interest rates to support employment, which risks pushing inflation higher, or keeping rates elevated to restrain prices, which could further slow the economy and increase financial pressure on consumers, businesses, and the federal government.
“The conversation keeps coming back to gold. When both of the Fed's options carry a cost, people start looking for something that sits outside the system, something that isn't tied to a rate decision or a printing press.”
Steve Rand
General Manager / Sr. Precious Metals Advisor

Gold Isn’t About Predicting the Next Crash

None of these warning signs guarantee that markets will implode overnight. Instead, the combination of corporate insiders’ and reputable investors’ warnings, the stock market’s excessive concentration in a brand-new technology, and the Fed’s challenging position indicate that investors may be operating within a smaller margin of error than markets alone imply.
That’s one of the main reasons smart money investors remain heavily allocated to physical gold bars and coins. Unlike stocks or bonds, gold isn’t tied to corporate earnings, government debt, or monetary policy decisions. Instead, it has historically served as a portfolio diversifier during periods of heightened uncertainty and financial stress.
“Most people don't think of their 401ks or their IRAs as a bet on any one big thing. But if half the index rides on a single story, your exposure might be bigger than you realize. That's not a reason to panic, but it is a reason to understand your own situation.”
Eric Sepanek
SBC Founder
If you’d like to learn about how physical gold and silver can be added to your retirement account, request your free copy of our popular Precious Metals Investor Guide or contact one of our helpful precious metals advisors today.
Question or Comments?
If you have any questions about today’s topics or want to see us discuss something specific in a future The Gold Spot episode, please add them here.
Comment
Questions or Comments?
"*" indicates required fields