Eric Sepanek
SBC Founder
Eric Sepanek is the founder of Scottsdale Bullion & Coin, established in 2011. With extensive experience in the precious metals industry, he is dedicated to educating Americans on the wealth preservation power of gold and silver.

John Karow
Precious Metals Advisor
John Karow is an experienced lawyer and Precious Metals Advisor at Scottsdale Bullion & Coin. He holds degrees from Lehigh University, the University of Missouri, Cornell University, and St. John’s University School of Law. John is a knowledgeable authority in precious metals, dedicated to helping clients navigate economic cycles and gold and silver investments.
Add SBC on Google as a preferred source to see more market related news like this when you search.
Within the first month of 2026, silver prices skyrocketed to a record of $121/oz. Although prices cooled soon thereafter, Scottsdale Bullion & Coin predicted that something big was around the horizon. That time seems to be arriving as silver gears up to retest $90/oz only a few months after climbing to a new peak. Understanding what brought silver to this all-new high can help shed light on the factors fueling the next potential rally, which many experts believe is right around the corner.
The Disconnect That Changed the Silver Market
In the midst of the March 2020 market panic, silver spot prices briefly fell to around $12/oz. However, a clear disconnect between the physical and paper market was growing. At the time, silver exchange-traded funds (ETFs), which heavily influence the spot price, were experiencing a lull in demand. Meanwhile, investors were diving headlong into the physical market.
Silver products were flying off the shelves as safe-haven demand took off. This physical consumption was evident in the rising dealer premiums, which quadrupled for some silver assets as buyers eagerly competed for limited availability.
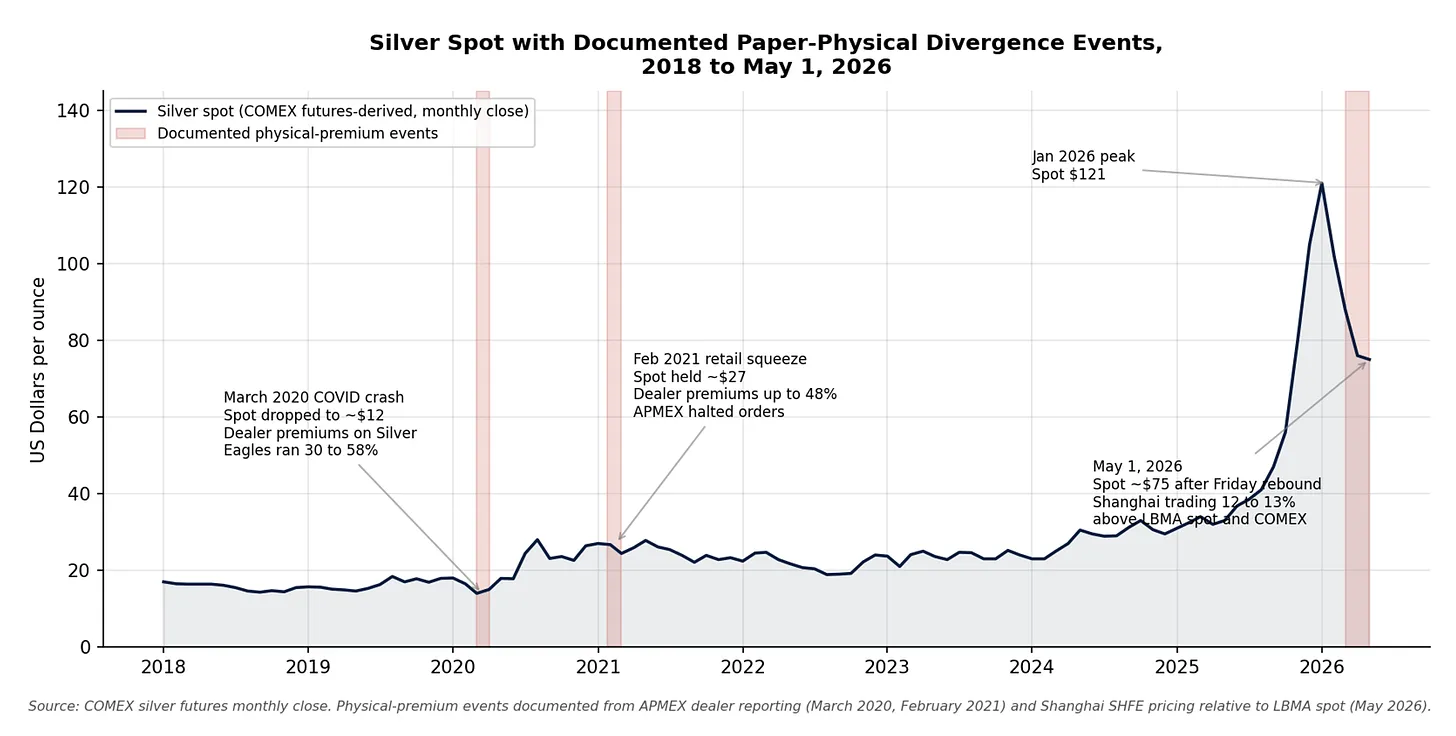
Image source: PrinSights Substack
Savvy investors recognized the unsustainable dissonance between what the spot price indicated and what was really happening on the ground. At Scottsdale Bullion & Coin, the analysts recognized this widening gulf between the paper and physical market as an auspicious sign of building upward pressure.
“The disconnection from the reality of what silver was worth and what the ETF markets were showing us as far as the spot price…was a signal for us. Then, we just saw a boom.”
Eric Sepanek
SBC Founder

Long-Running Pressure on Silver Began to Crack
This accurate forecast wasn’t based on speculation or hopium. Instead, it was borne out of a careful analysis of years’ worth of data, behind-the-scenes activity, and decades of hands-on experience. What most investors don’t realize is that the silver market, which is significantly smaller than its gold counterpart, has been heavily influenced by major financial institutions. This strong indication became an emerging consensus over the decades, until the long-term manipulation was uncovered.

In 2020, J.P. Morgan agreed to pay $920 million to settle federal investigations into widespread manipulation of the precious metals market through spoofing trades. Effectively, authorities concluded that traders had illegally influenced precious metals prices by using deceptive futures market orders to manipulate short-term price movements in their favor.
The investigation culminated in 2023 with the imprisonment of two J.P. Morgan precious metals traders in federal facilities, vindicating decades of rumors. Although J.P. Morgan dominated the headlines surrounding the investigation, a total of eight major banks became entangled in the broader probes into precious metals manipulation. Collectively, these financial institutions paid more than $1.3 billion in settlements.
For the first time in decades, the artificial lid that had held silver prices below real-world supply-and-demand valuations appeared to lift. This largely explains silver’s momentous leap to record highs at the onset of 2026.
“The infrastructure that held silver prices down was beginning to crack, and we are paying close attention to that today.”
John Karow
Precious Metals Advisor
The Technical Picture Becomes Clearer
While the background machinations of big banks were coming to light in the silver markets, the silver price chart was flashing its own bullish signal. In an episode of The Gold Spot in 2025, the Scottsdale Bullion & Coin team highlighted the five-decade-long cup-and-handle pattern forming on the silver chart. In technical analysis, which studies historical price patterns and market trends to forecast future price movements, the cup-and-handle formation is among the most bullish developments.
In short, a cup-and-handle formation indicates that a market is recovering from a prolonged decline, steadily consolidating over time, and building up momentum for a major breakout into price discovery mode. In terms of market activity, this development shows that sellers are ceding ground to buyers, who ultimately push prices higher. This particular pattern had been developing since the 1970s, with an initial breakout in 2025, leaving plenty of room to run.

Between 2018 and 2025, silver gradually rose from under $20/oz to around $30/oz, before exploding to a record high over $120/oz. From January 2025 to January 2026 alone, the shiny metal surged from around $30/oz to an all-time high, marking a over a 300% increase in a year.
A Structural Supply Crisis Emerges
While technical indicators and legal developments helped explain shifting sentiment around silver, the metal’s long-term fundamentals were also rapidly strengthening beneath the surface.
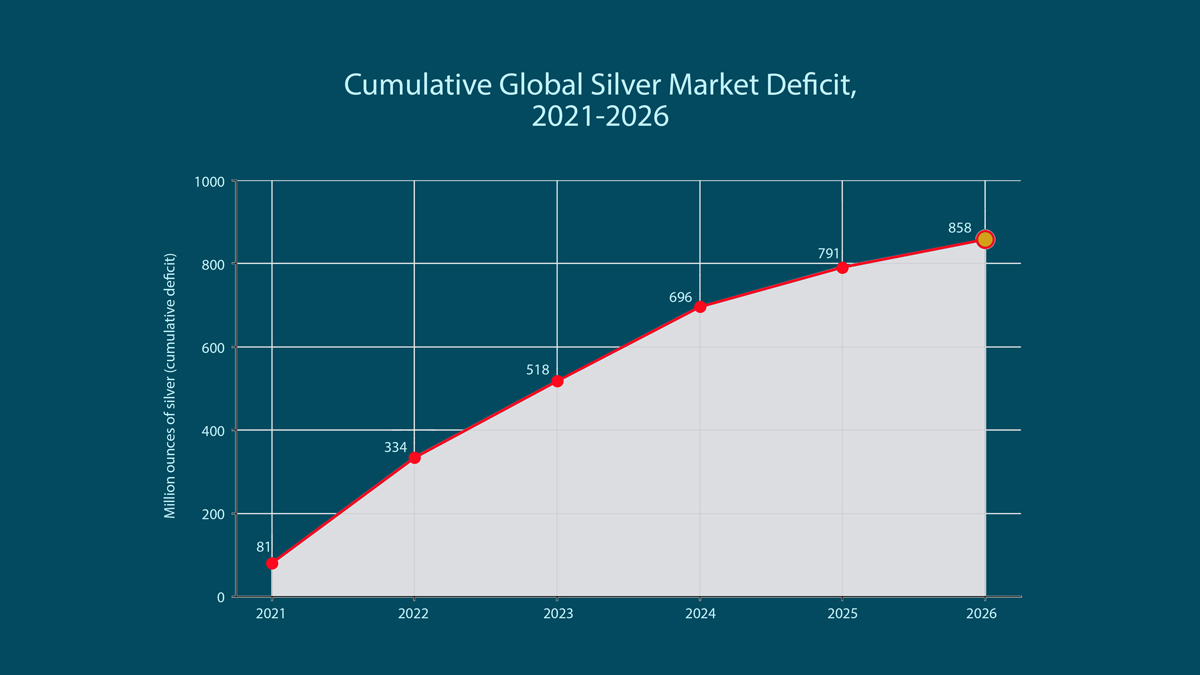
From 2021 through 2025, the silver market recorded five consecutive annual supply deficits. Combined, these shortages exceeded 800 million ounces (Moz), roughly equivalent to an entire year of global mine production removed from the market. Market leaders predict that 2026 will mark the sixth straight year of silver deficits.
Why Silver Supply Can’t Easily Expand
Unlike gold, silver production is heavily dependent on the mining of other industrial metals. Roughly 70% to 80% of the global silver supply comes from byproducts of copper, lead, and zinc mining. This means silver output cannot simply ramp up in response to rising prices, leaving the market vulnerable to prolonged shortages when demand surges.
Industrial Demand Hits Record Levels
At the same time, industrial demand continued to accelerate. In 2024, industrial silver demand climbed to a record 680.5 Moz. Projections for 2025 crossed 700 Moz for the first time in history, with industry accounting for roughly 59% of total silver demand. Unlike speculative demand, which can come and go, this demand reflects real-world consumption from rapidly expanding industries increasingly reliant on silver.
Solar, EVs, and AI Intensify the Physical Squeeze
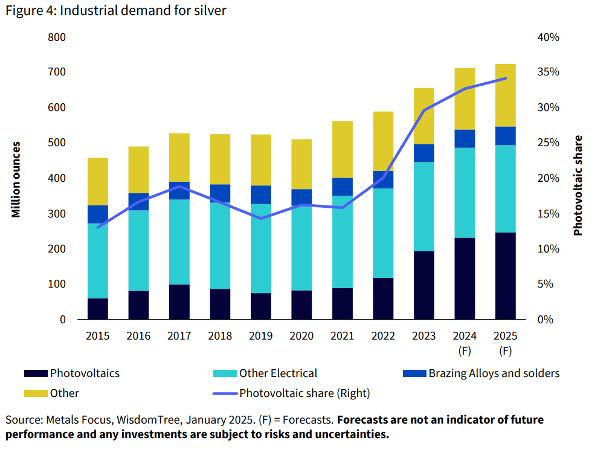
Solar panels consumed nearly 197.6 Moz of silver in 2024, representing close to one-quarter of the annual global mine supply. At the same time, electric vehicles and AI infrastructure have dramatically increased industrial demand. Data centers, semiconductors, and advanced computing systems all rely heavily on silver because of its unmatched conductivity.
By late 2025, the physical market began showing major strain. London Bullion Market Association vault inventories declined sharply, while silver borrowing costs reportedly surged above 200% annualized as traders scrambled to secure deliverable supply. Once shortages pressured the paper market, silver repriced rapidly.
The Gold-to-Silver Ratio Signals More Upside
Another major factor analysts are watching is the gold-to-silver ratio, which measures how many ounces of silver it takes to equal the price of one ounce of gold.
The ratio climbed as high as 120:1 during the 2020 market panic, then compressed to below 50:1 by early 2026 as silver dramatically outperformed. Historically, the ratio traded much closer to 16:1, reflecting the natural geological abundance ratio between gold and silver.
Some analysts now project additional compression toward 40:1, or even 30:1. With numerous prominent gold price forecasts for 2026 placing gold near $6,000/oz, these ratios would imply silver prices approaching $200/oz. This optimistic forecast falls in line with the market consensus for 2026 silver price predictions. Some experts even outline a potential for silver to reach $300/oz.
New Silver Investor Report Available Now!

If silver is truly entering a new era, investors may want to understand the forces driving the market before the next major move unfolds. To learn more, request your FREE copy of our newly updated report: Silver: The Awoken Giant. It covers everything you need to know about the supply shortages, industrial demand trends, and market dynamics reshaping the future of silver.