
Eric Sepanek
SBC Founder
Eric Sepanek is the founder of Scottsdale Bullion & Coin, established in 2011. With extensive experience in the precious metals industry, he is dedicated to educating Americans on the wealth preservation power of gold and silver.
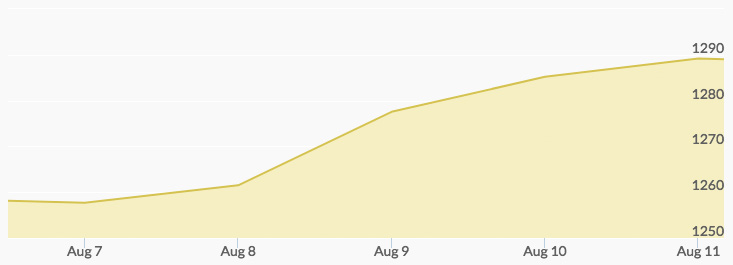
The historical price of gold chart reported a 2.3 percent rise for the yellow metal last week. Monday opened with the price of gold at $1,258.01, and light trading took this number to $1,257.92 by the end of the day. Aftermarket buying pushed the Tuesday opening up nearly five dollars to $1,262.66; the day closed with gold prices at $1,262.15. Solid buying marked the remainder of the week. Wednesday saw an opening bid of $1,271.52, and steady buying drove the closing bid to $1,277.11 and Thursday’s opening to $1,285.67. Even sideline traders stepped in on the action, increasing trading volume and resulting in a close of $1,286.68. Friday opened at $1,286.90, and trading brought the week’s high of $1,291.00 by midafternoon. The close at $1,289.31 marked a better than $30 increase for the week.

The price per ounce of gold last week was very close to its high for the year, set in June. While many analysts pointed to the escalating tensions between the U.S. and North Korea, especially the direct threat to U.S. protectorate Guam, a number of them also attributed gold’s strong performance to the amount of funds flowing in from a broad range of traders and investors. 1
What affects gold prices? Several factors: the ongoing challenges in U.S. politics, missed inflation numbers, and growing concerns over China’s economy. These are just a few of the reasons that some analysts predict a price well above $1,300 and higher if the tensions continue to grow. 2 3 On the flip side, a few analysts that see higher prices also think there may be buying opportunities as the market corrects for this rapid rise over the past week.
While the primary trading focus this week will be tracking developments relative to North Korea, attention will also focus on Monday’s Treasury bill auction, Wednesday’s housing starts data, and the early numbers for jobless claims on Thursday.