
Damian White
Sr. Precious Metals Advisor
Damian White is a Sr. Precious Metals Advisor at Scottsdale Bullion & Coin. With a background in business and finance, he transitioned from real estate finance to focus on precious metals in 2016. Damian is dedicated to educating investors on the benefits of gold and silver, emphasizing the importance of wealth preservation and proper asset allocation.
Joe Elkjer
Precious Metals Advisor
Joe Elkjer, a Precious Metals Advisor at Scottsdale Bullion & Coin since 2019, specializes in helping clients protect their assets through tangible investments. With a strong background in business and finance, he emphasizes stellar customer service and stays dedicated to informing clients about market impacts through frequent appearances on The Gold Spot.
Add SBC on Google as a preferred source to see more market related news like this when you search.
Headlines have been bouncing around nearly as much as gold prices over the past few days, leaving many investors wondering where the market is going. The disconnect between record-setting official demand intentions and tepid price action certainly isn’t helping the confusion.
In this week’s The Gold Spot, Scottsdale Bullion & Coin’s Precious Metals Advisors Damian White and Joe Elkjer cut through the market noise to clarify gold’s overarching momentum, exploring whether recent price weakness represents a warning sign or merely a pause in a longer-term bull market.
Gold Tests a Critical Long-Term Trendline
For the first time since October 2023, gold prices have fallen below their 200-day moving average. This measurement is commonly used by technical analysts to gain insight into an asset’s long-term trend. Essentially, the 200-day moving average smooths out daily price swings over this period, providing a clearer picture of how an asset is moving. For nearly 20 months, gold prices remained above this trend line, indicating strong upward momentum.

Since late May, the spot price has been flirting with the 200-day moving average as stronger-than-anticipated economic data and fading expectations of Federal Reserve rate cuts have weighed on its safe-haven appeal. On June 5, a surprisingly positive jobs report pushed gold below this closely watched trendline after nearly 20 months above it.
By the time gold reached its recent low, the metal had retreated roughly $400/oz, or nearly 10%, from a recent peak. Shortly thereafter, the yellow metal charted a $140/oz reversal to the upside after fears of an imminent U.S. strike on Iran eased. Gold subsequently recovered roughly 8% from those lows. However, the next move remains undetermined.
Why the Fed Has Less Room to Maneuver
Gold is currently facing a tough macroeconomic backdrop, as persistent inflation and a resilient economy have reduced the Federal Reserve’s ability to continue rate cuts. More specifically, non-yielding assets often experience a slowdown in demand while interest rates remain elevated.
Although some investors had hoped the Federal Reserve would continue easing monetary policy, the new Fed Chair’s intentions are overshadowed by a challenging economic climate. The combination of a nearly $40 trillion national debt, $1 trillion in interest payments, and inflation hovering near 4% cuts against a rate-cut strategy.
On June 17, the Federal Open Market Committee, in its first meeting under Warsh, decided to keep rates steady at 3.5% to 3.75%. Policymakers project a limited number of rate cuts through the end of 2026, but this remains far below expectations set toward the end of 2025 and the beginning of this year.
Central Banks Continue Their Historic Gold Buying Spree
The spot price routinely experiences periods of volatility, and interest rates consistently ebb and flow, but one of the core pillars of gold’s strength remains unyielding. Central bank gold demand is experiencing one of the most aggressive accumulation cycles in modern history. Between 2022 and 2024, governments purchased more than 1,000 tons annually. In 2025, global stockpiles increased by 863 tonnes.
In the World Gold Council’s most recent central bank survey released on June 16th, 45% of reserve officials said they plan to increase their gold reserves over the next year — the highest share on record and a sharp increase from 29% in the previous survey. Another 89% expect global gold holdings to expand over the same time frame. Of the 76 central banks surveyed, only a single institution plans to sell.
“That's not a maybe buyer base. That's the largest single year of expected official sector demand on record for this poll.”
Damian White
Sr. Precious Metals Advisor

Experts Maintain Bullish Convictions
Another revealing indication of gold’s underlying bullishness, despite what short-term price movement may suggest, is the positive outlook maintained by major institutions, market leaders, and famed investors. Our aggregate of over 30 experts shows that 2026 gold price predictions remain above $6,000 per ounce. Some of the biggest names in banking remain optimistic, including:
| Financial Institution/Analyst | Gold Price Predicted (per oz) |
|---|---|
| Wells Fargo | $6,300/oz |
| JP Morgan | $6,000/oz |
| Citi | $6,000/oz |
| Deutsche Bank | $6,000/oz |
| UBS | $5,600/oz |
| Goldman Sachs | $4,900/oz |
“You have a near-term chart that is undecided, sitting on top of a long-term demand pattern that's about as strong as it's ever been measured. These two things are not in conflict. They're operating on a different time frame. And that's exactly why this is not a time to sell into a technical retest.”
Damian White
Sr. Precious Metals Advisor
Silver May Be Flashing an Early Signal
The never-ending battle between gold and silver for the precious metals spotlight has favored the yellow metal, but investors shouldn’t ignore its shiny cousin. Looking at the metal’s 2026 year-to-date performance, silver prices are down around 40% from their January peak.
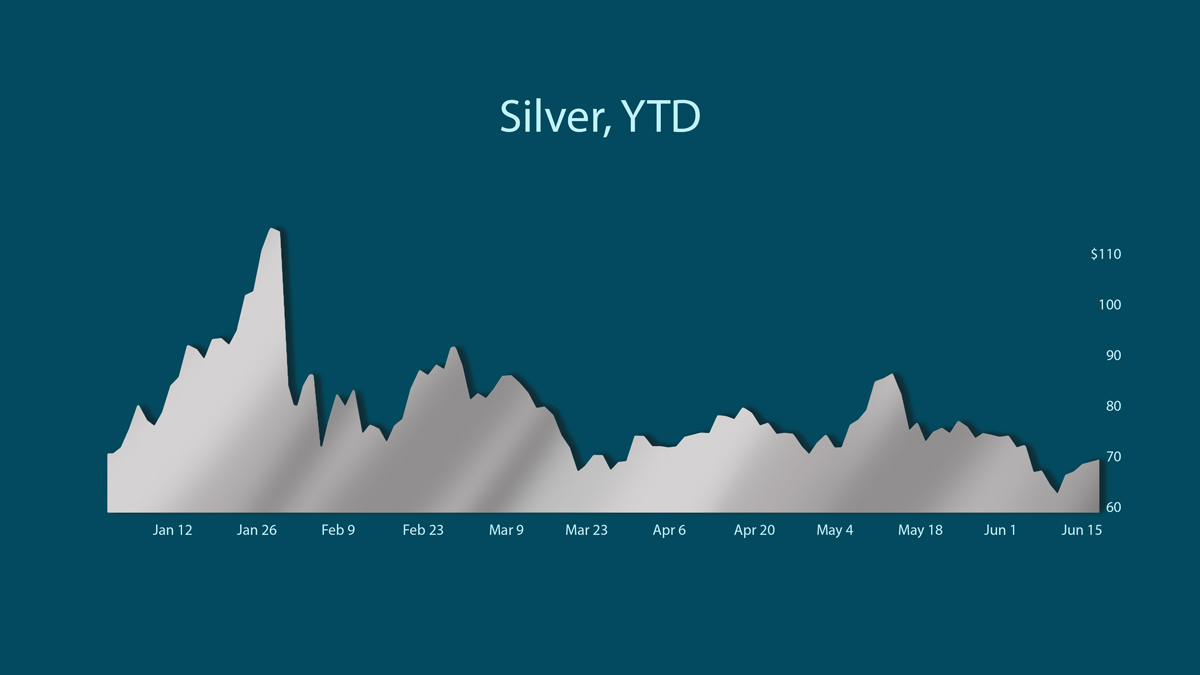
In a similar sign of short-term weakness, silver recently experienced a sharp drawdown from recent highs. However, silver slightly outshone its counterpart with a larger recovery of 3.5%. During this swift rebound, the gold-to-silver ratio tightened from 64:1 to 61:1 within weeks. This metric tracks the amount of silver needed to equal one ounce of gold. Generally, a constricting gold-to-silver proportionality signals an outperformance by silver.
“That's not noise. That's silver getting relatively stronger than gold in real time. And that's usually an early tell. Not a confirmation, but it's the thing you want to see before the bigger reversal shows up.”
Joe Elkjer
Precious Metals Advisor
When Weak Hands Leave the Market
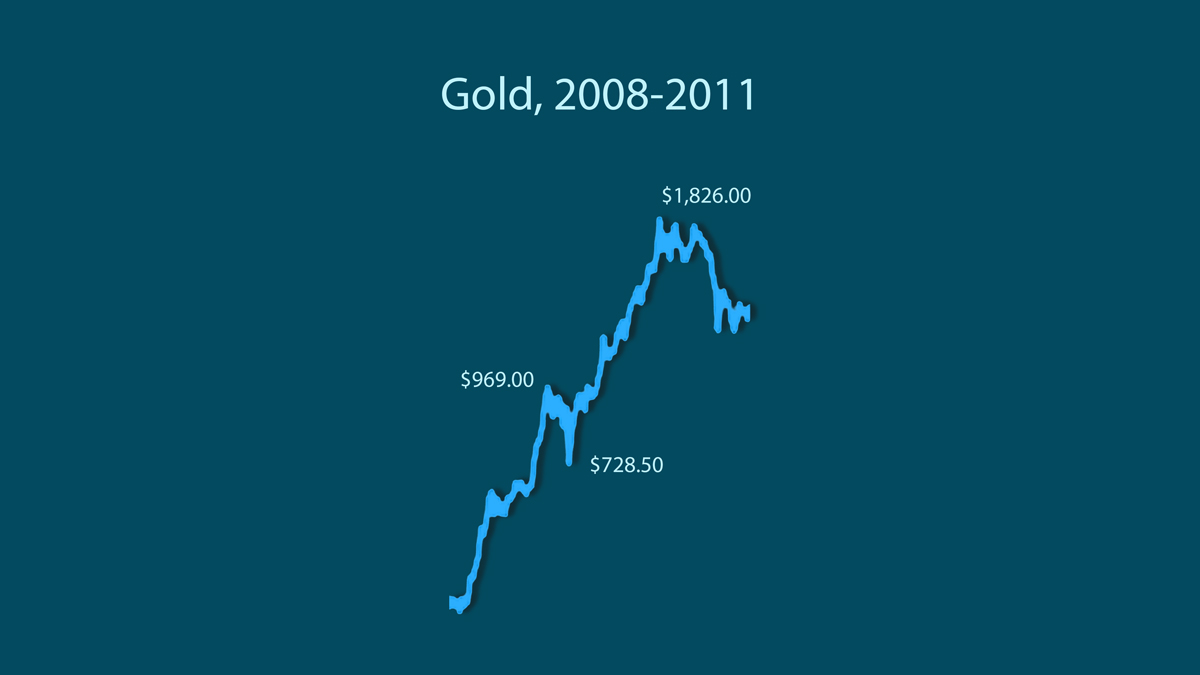
History repeatedly demonstrates how sharp pullbacks can precede meteoric spikes in precious metals. Between 1974 and 1976, silver plummeted by around 45% before marking a historic four-year rally. In the same period, gold prices nearly halved, eventually leading to the skyrocketing boom experienced in the 1980s. During the 2008 global financial crisis, gold tanked by 30%, then rose from $700/oz to $1,900/oz by 2011.
Right now, positioning across precious metals markets suggests another washout may be in place. Open interest in gold and silver futures has sunk to its lowest level in over 10 years. This signals that many speculative traders — which can exacerbate short-term volatility — have exited the market. Although no indicator can confirm a market bottom, the combination of collapsing open interest and improving relative strength in silver resembles previous corrections that ultimately gave way to renewed upside.
The Bigger Picture Remains Unchanged
Gold’s short-term price movements remain anyone’s guess, but the most foundational forces supporting precious metals remain solid. Central banks continue loading up on gold at a ravenous pace, policymakers are hamstrung by above-target inflation and towering debt burdens, and markets appear to be wiping out speculative investors.
Countless investors have sold into similar corrections, only to look back and realize they exited just before the market’s next major move higher. As always, the tried-and-true precious metals investment wisdom is to buy gold and wait for the next leg up, rather than waiting to act until it’s too late.
If you’re interested in learning more about what’s happening in the silver market, grab a FREE copy of our latest report, Silver: the Awoken Giant. It covers the full spectrum of silver’s investment case.

Question or Comments?
If you have any questions about today’s topics or want to see us discuss something specific in a future The Gold Spot episode, please add them here.
Comment
Questions or Comments?
"*" indicates required fields