
Todd Graf
Precious Metals Advisor
Todd Graf is a seasoned Precious Metals Advisor at Scottsdale Bullion & Coin. He has a decade-long career in finance, previously at Morgan Stanley and Vanguard. He is Series 7 licensed and has extensive experience in traditional and defensive assets, providing clients with solid investment strategies.

Joe Elkjer
Precious Metals Advisor
Joe Elkjer, a Precious Metals Advisor at Scottsdale Bullion & Coin since 2019, specializes in helping clients protect their assets through tangible investments. With a strong background in business and finance, he emphasizes stellar customer service and stays dedicated to informing clients about market impacts through frequent appearances on The Gold Spot.
Once again, gold has soared to all-time highs, nearing $3,800/oz after months of sideways trading. This upward boom has sparked recurring fears of an overheated market, but the yellow metal’s crucial, yet widely overlooked, connection with the money supply points to bullish horizons.
In this week’s The Gold Spot, Scottsdale Bullion & Coin’s Precious Metals Advisors Todd Graf and Joe Elkjer discuss how the sheer amount of money in the economy influences gold’s true value, why central banks continue topping up reserves even as gold reaches new peaks, and why gold prices are still cheap.
Gold Spot Prices Climb Near $3,800 Per Ounce
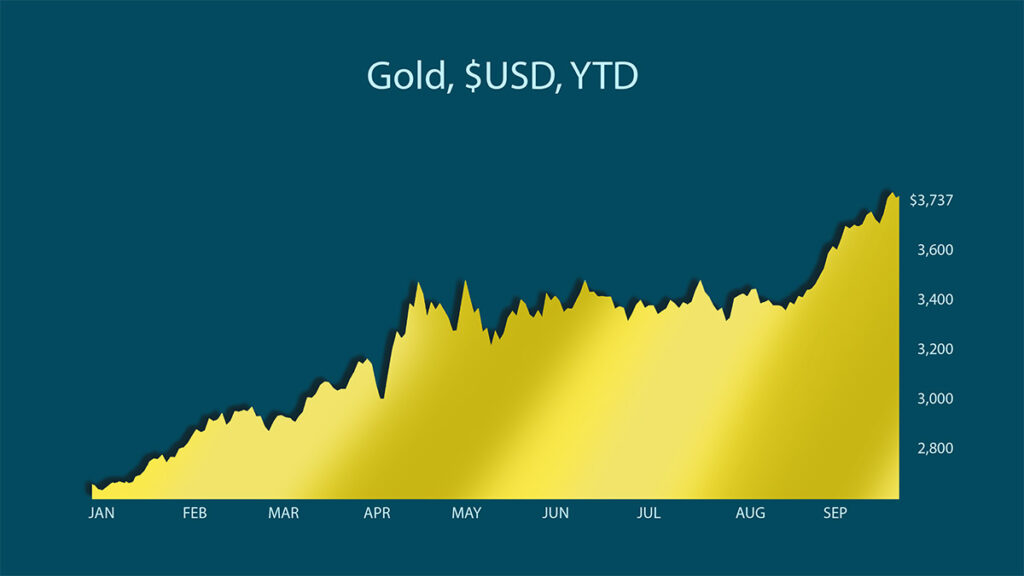
After months of consolidation, the bulls have been proven right as gold prices break out to new highs, with spot gold prices reaching a record high of $3,790.82 on Tuesday, September 23, 2025. Currently, the metal is priced at just under $3,800/oz. So far in 2025, gold prices have surged by more than 42%, outpacing 2024’s full-year gains already. With a myopic view on the spot price, many investors mistakenly assume the rally is nearing its end.
What is the M2 Money Supply?
The M2 money supply is the most widely followed gauge of how much money is circulating in the economy. It covers more than just cash and checking accounts, referred to as M1, by also including savings deposits, small certificates of deposit under $100,000, and retail money market funds. In other words, M2 represents both the money people spend on a daily basis and the savings they can quickly draw upon when needed.
Economists track it as a barometer of liquidity and a signal of how much purchasing power the dollar may be losing. For gold investors, its importance is clear: when the supply of money swells, gold’s role as a finite store of value becomes even more compelling.
How the Money Supply Shapes Gold’s Value
Gold’s value has been deeply intertwined with the amount of money in an economy for millennia. In the past, this connection was under direct control of the government through the gold standard, when a specific amount of gold was tethered to a set dollar amount. Even after the abandonment of the gold standard, the money supply has continued to have a strong influence on the trajectory of gold prices.
In a fiat system, every debased dollar pumped into the system reduces the currency’s value. Since the gold supply is limited, it’s reasonable to assume its price would rise in relation to deflation. This is currency debasement in a nutshell. Simply put, gold tends to rise when the M2 money supply expands considerably. This phenomenon has been illustrated several times in recent history:
- 1970s Stagflation: With the money supply and inflation surging, gold exploded from $35 in 1971 to $850 in 1980, a gain of more than 2,300%.
- 2008 Global Financial Crisis: Amidst deep quantitative easing and rapid money supply growth, the yellow metal climbed from $700 in late 2008 to $1,900 by 2011, increasing by more than 170%.
- 2020 Pandemic Spending: A federal stimulus pumped over $4.5 trillion into M2 in just two years, sending gold from $1,500 in early 2020 to $2,070 by August, a nearly 40% jump.
Many gold analysts prefer to track the metal’s relationship with the overall money supply rather than focusing solely on the spot price, which can be influenced by market variables unrelated to its real value.
The Cost of Endless Printing
Under the misguided framework of Modern Monetary Theory, the federal government has been pumping money into the economy without concern for the negative repercussions. The $37 trillion national debt speaks for itself. Overprinting has been an issue for decades, but it greatly accelerated following the pandemic.
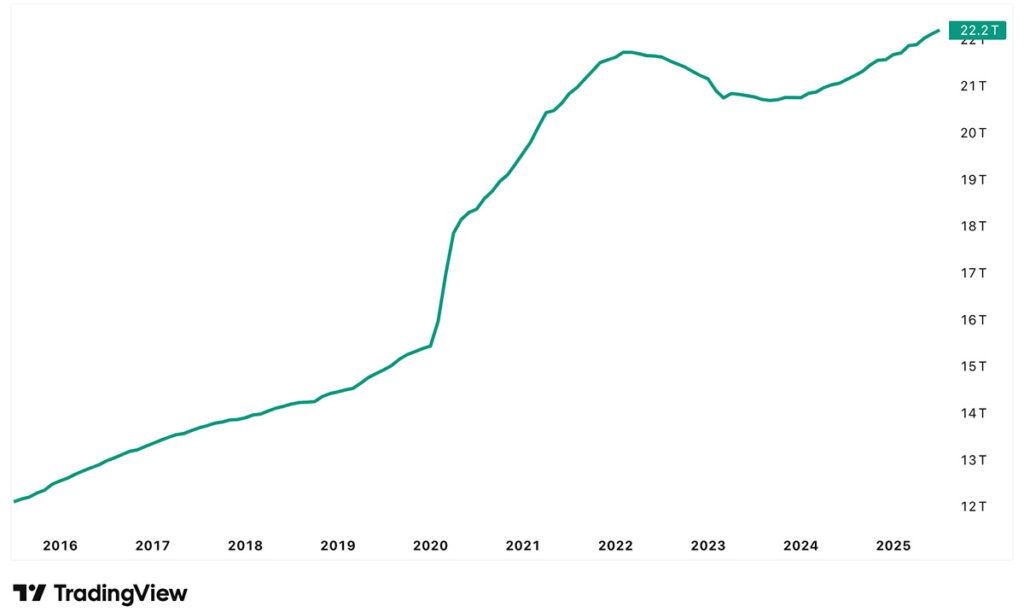
US M2 Money Supply Chart: 2016 to 2025. Source: TradingView.com
Since 2020, the Federal Reserve has increased the M2 money supply by more than 37%. Looked at over a longer timeframe, it’s skyrocketed by 400%. Currently, there is an eye-watering $22 trillion floating around in the economy.
Central Bank Buying Follows Liquidity, Not Production
When narrowing the focus on gold’s spot price, the rally appears to be reaching a top. Unfortunately, this singular, incomplete picture is convincing many investors that the metal is due for a serious correction or a complete reversal.
However, central bank buying contradicts this misinterpretation. Over the past three years, official gold demand has remained elevated at an unprecedented pace of 1,000 tons annually. H1 2025 consumption suggests 2025 will mark the fourth straight year.
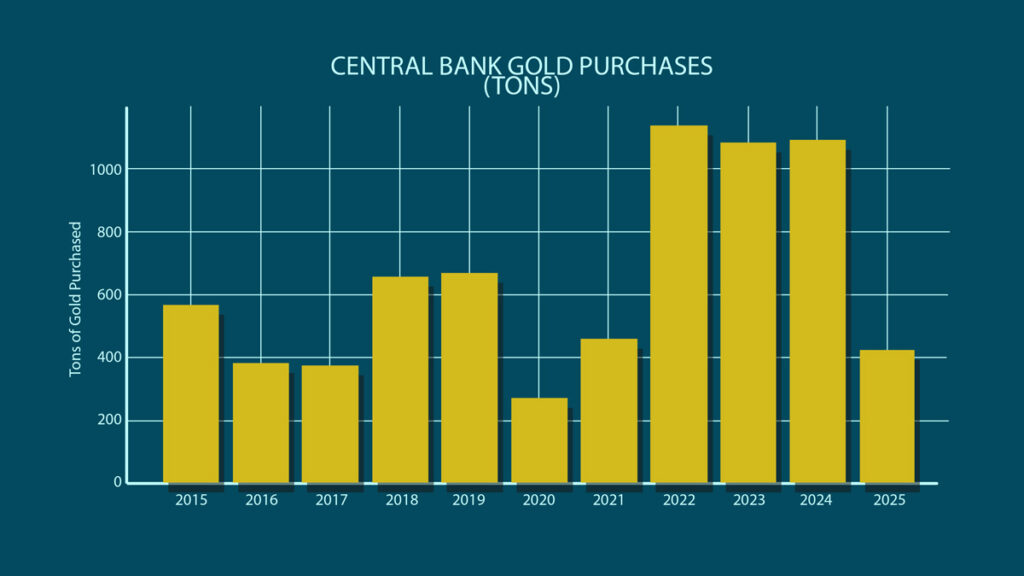
China, one of the world’s most voracious gold consumers, added a whopping 225 tons of gold in 2024. Their relentless demand continues at pace in 2025. Similarly, other emerging economies, such as Poland, India, and Russia, are also pouring into physical gold.
“While everyone fixates on nominal, all-time highs. Central banks are looking at a completely different metric: Gold's price relative to global money supply. That's what's important right now.”
Todd Graf
Precious Metals Advisor

What does the M2 money supply say gold is worth?
In a vacuum, gold at $3,800/oz could be reasonably seen as a high price, especially given the speed at which gold has risen. Yet, when considering the broader relationship to the ever-expanding M2 money supply, gold looks like a bargain.
“Gold at $3,800 is actually undervalued. Gold is going to be undervalued for the foreseeable future because the dollar is going to keep losing value.”
Joe Elkjer
Precious Metals Advisor
If the yellow metal rose to its 2011 ratio with the money supply, the spot price would hit $4,400 – confirming the projections of many experts that $4,000 is within reach. Gold would more than double that amount if it fell back in line with its 1980s ratio, stretching to $9,700/oz!
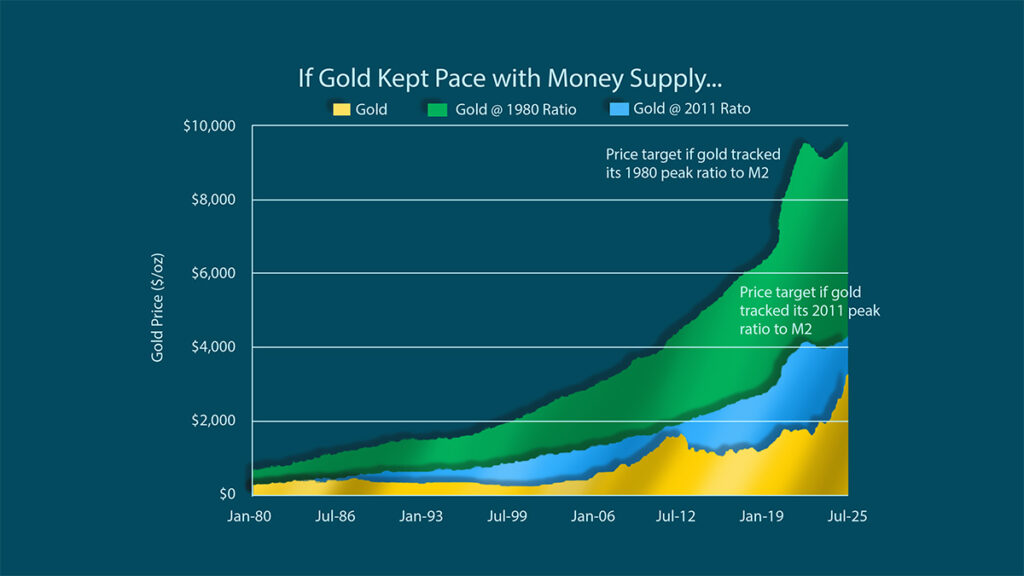
Chart source: katusaresearch.com
The Bigger Story Behind Gold’s Rise
Gold’s rise against the backdrop of an ever-expanding money supply makes clear that today’s prices are not the end of the story, but a reflection of deeper forces reshaping global finance.
“There's never been a more important time to understand how precious metals could protect you.”
Joe Elkjer
Precious Metals Advisor
To understand how this monetary shift is cementing gold’s role at the center of the financial system, and why central banks are leading the charge into bullion, check out our free Gold Rush 2.0 report.
 SUGGESTED READING
Question or Comments?
If you have any questions about today’s topics or want to see us discuss something specific in a future The Gold Spot episode, please add them here.
Comment
Questions or Comments?
"*" indicates required fields