
Steve Rand
General Manager / Sr. Precious Metals Advisor
Steve Rand is the General Manager and a Sr. Precious Metals Advisor at Scottsdale Bullion & Coin. He brings over 20 years of experience in the physical precious metals markets.

Joe Elkjer
Precious Metals Advisor
Joe Elkjer, a Precious Metals Advisor at Scottsdale Bullion & Coin since 2019, specializes in helping clients protect their assets through tangible investments. With a strong background in business and finance, he emphasizes stellar customer service and stays dedicated to informing clients about market impacts through frequent appearances on The Gold Spot.
Gold is staging a strong rally today, surging over $50 an ounce on renewed safe-haven demand. However, while gold is grabbing headlines today, silver has broken through a key resistance level, drawing growing interest from investors. Could this be the start of an epic silver rally?
In this week’s The Gold Spot, Scottsdale Bullion & Coin Precious Metals Advisors Steve Rand and Joe Elkjer discuss the extended gold-to-silver ratio, why price suppression could lead to explosive growth, and the bullish cup-and-handle pattern.
Gold-to-Silver Ratio Shines on Gold
Silver spot prices recently crossed the $35 an ounce resistance level for the first time since 2011, signaling renewed strength after months of muted performance. This spike has led many experts to predict a massive incoming rally, as the shiny metal has plenty of room to run before catching up to gold’s tremendous rise. The gold-to-silver ratio, which measures how many ounces of silver equal one ounce of gold, is a common indicator used to determine their relative value.
The yellow metal’s ongoing rally has extended this ratio closer and closer to record levels, recently reaching over 100:1. Generally, anything over 80:1 suggests silver is “underbought” or “cheap” compared to gold. Notably, the gold-to-silver ratio has been steadily hovering above this critical point for months, indicating a significant build-up of upward pressure.
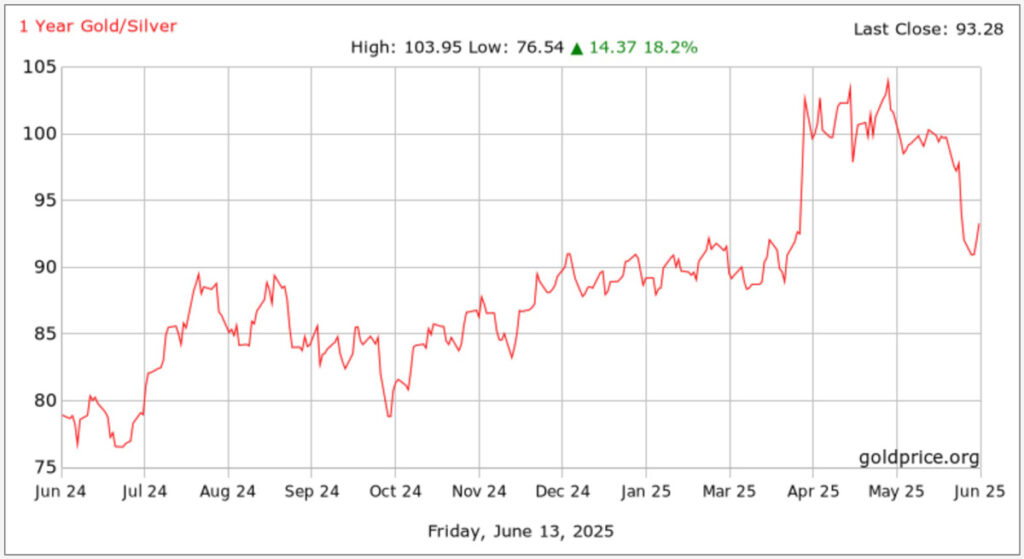
1 Year Gold Silver Ratio History. Source: goldprice.org
“Silver has huge, huge amounts of catching up to do to get to where its value really is.”
Joe Elkjer
Precious Metals Advisor

👉 Suggested Reading: Silver’s Time to Shine? The Hidden Market Signal Investors Can’t Ignore
Price Suppression Breakout?
For decades, investors and experts have speculated about the impact of price manipulation in the silver market. The federal conviction of two JP Morgan precious metals traders vindicated these concerns and exposed one of the world’s largest investment banks.
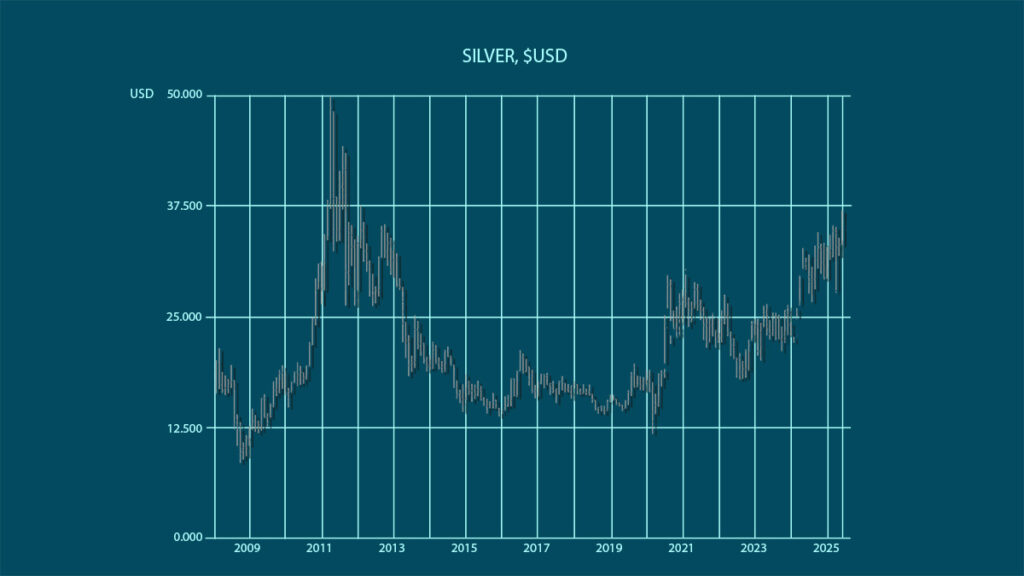
With silver’s dual role as a precious and industrial metal, there’s growing concern that major financial institutions and other big players will continue driving down the silver price to scoop up the high-demand metal at lower costs. The recent jump over $35 an ounce, which silver prices have traded under for nearly 13 years, could indicate the surging silver demand is simply too much for price suppression to handle.
Silver’s Bullish Cup-and-Handle Pattern
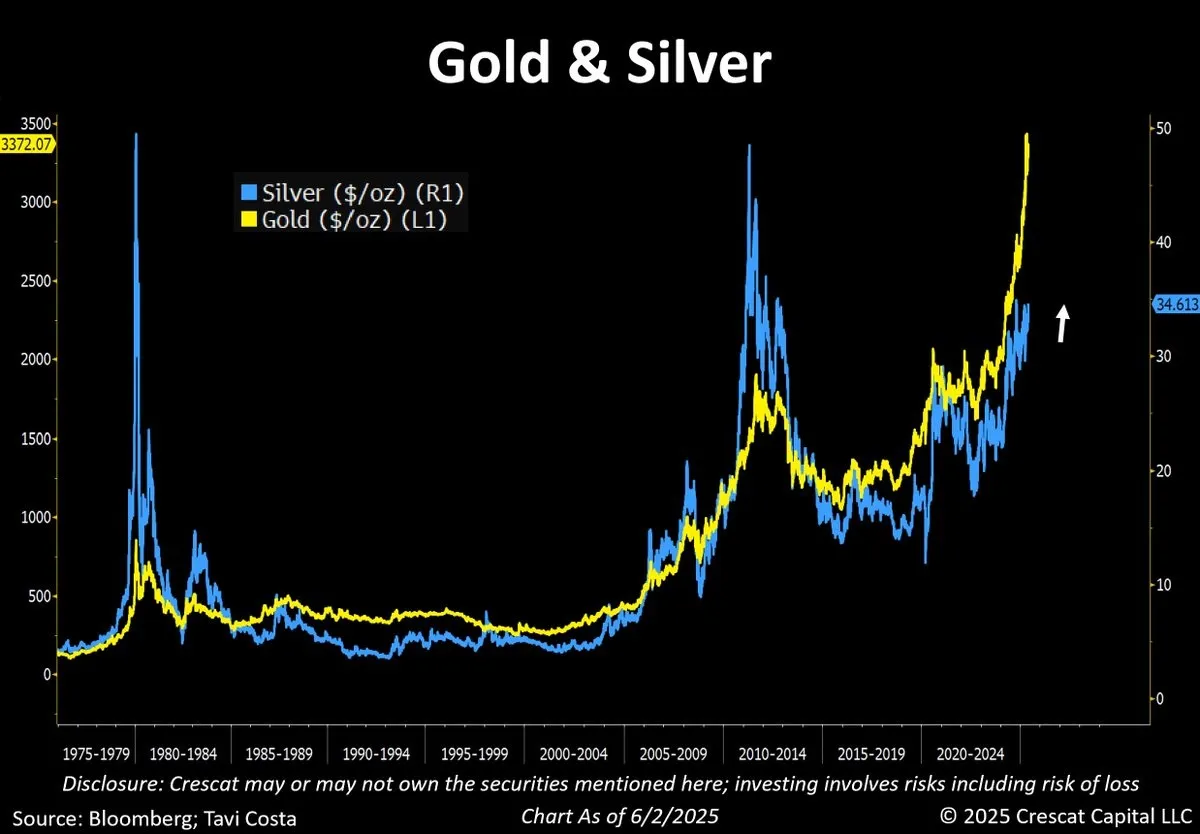
It’s not only silver’s spot price reaching relative highs that has experts optimistic. The metal’s price action is upbeat from a technical perspective, too. A closer look at the charts reveals a long-term cup-and-handle pattern and an attempted breakout.
In this bullish chart formation, price action forms a rounded ‘cup’ followed by a smaller sideways or downward-sloping ‘handle,’ signaling building buying momentum and the potential for a breakout above resistance. The gold market exhibited this same cup-and-handle pattern before exploding to the upside. Following the completion of the “cup” consolidation, prices surged from $2,000 to $3,500 an ounce in a little over a year.
“We’re definitely seeing a big sentiment change when it comes to silver. There’s huge upside potential.”
Joe Elkjer
Precious Metals Advisor
Experts Raise Silver Price Predictions
Analysts had made bullish 2025 silver price predictions at the beginning of the year. However, this strong setup is leading to many price forecast increases.
- The author of Rich Dad, Poor Dad, Robert Kiyosaki, thinks silver prices could triple from where they are right now within the year
- Gold Seek and Silver Seek’s Peter Spina predicts $50 in the short term and sets a $100 target in the event of a short squeeze.
- Peter Krauth, the author of Silver Stock Investor, sees silver prices rising to $40 in 2025, $50 in 2026, and even $300 an ounce silver under the right conditions.
Don’t Sleep on Gold
The spotlight might be shining on silver right now, but investors shouldn’t be overlooking gold. Central banks continue scooping up gold bullion despite near-record prices. This elevated consumption is the primary fuel of the gold rally, indicating gold prices could still move higher. At its roots, this global transition into physical gold is sparked by a disintegrating global economy, as the dollar’s world reserve status is eroding and geopolitical instability is on the rise.
“Central banks see huge problems with the world economy and they’re accumulating gold for that reason. They don’t want to be in paper.”
Steve Rand
General Manager / Sr. Precious Metals Advisor
👉 Suggested Reading: $5,000 Gold?! Why It Might Be Coming Faster Than You Think
A Crucial Time for Silver
With the US dollar losing value, governments shifting focus from fiat currencies, and uncertainty reaching new peaks, it’s a crucial time for investors to understand how physical gold and silver can protect their wealth.
Our Silver Investor Report: Silver, A Sleeping Giant? goes in-depth about silver’s unique role in a portfolio, what drives its price movement, and how it can secure your financial future. Grab your FREE copy today.
Unlock Silver Investor Trade Secrets in our Investor Report.
Get Your Free Report
Question or Comments?
If you have any questions about today’s topics or want to see us discuss something specific in a future The Gold Spot episode, please add them here.
Comment
Questions or Comments?
"*" indicates required fields