
Eric Sepanek
SBC Founder
Eric Sepanek is the founder of Scottsdale Bullion & Coin, established in 2011. With extensive experience in the precious metals industry, he is dedicated to educating Americans on the wealth preservation power of gold and silver.

 Silver’s newest milestone signals a structural shift in both the precious metals market and the broader economy — one no investor can afford to overlook. This isn’t just another record; it’s the clearest expression yet of a rapidly evolving financial landscape. The ripple effects are only starting to surface, and understanding them now can help investors position their portfolios for stronger protection and greater upside.
Silver’s Historic Break Above $60
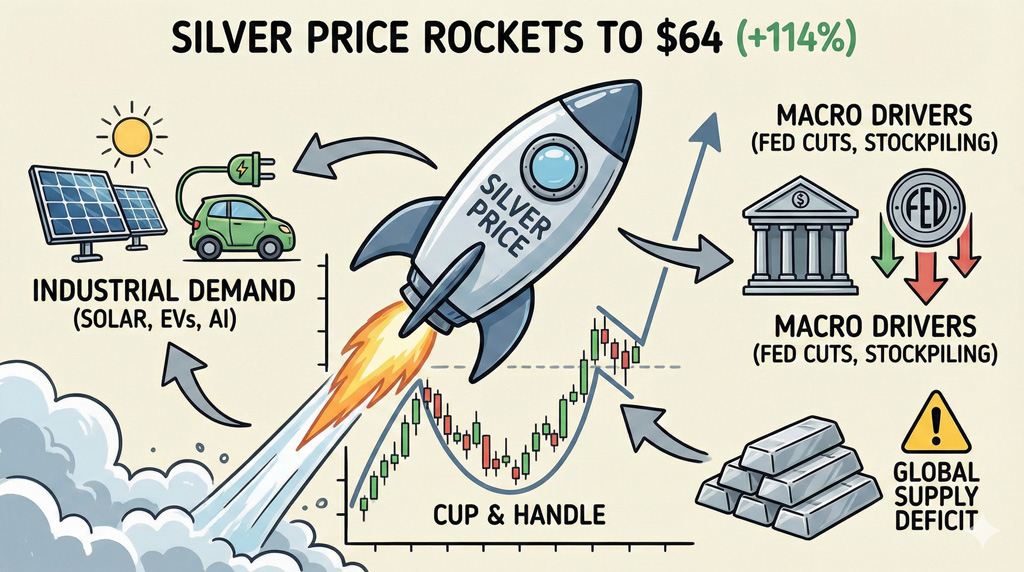
Silver has crossed $60/oz for the first time in history, coming close to $65/oz in intraday trading. This new record brings the metal’s year-to-date gains to an eye-catching 114%. For context, gold prices — which have also hit all-time highs above $4,000/oz — are up 61%.
The shiny metal has not only doubled in 2025, but it has nearly doubled gold’s growth, which underscores the metal’s remarkable strength. This rally is being driven by a rare combination of persistent supply shortfalls, booming industrial demand, supportive monetary policy, and broader economic weakness.
Core Market Drivers Behind the Silver Surge
Industrial Demand Acceleration
Industrial demand remains one of the single largest sources of consumption for the silver market, and the subcategories continue expanding. The solar industry remains the most active buyer, although electric vehicles and hybrids are using more silver.
Power grid upgrades and broad electrification efforts are also expanding demand. Artificial intelligence is among the fastest-growing and transformative sources of silver demand.
ETF Positioning and Investment Flows
This industrial consumption is complemented by robust investment flows. Silver exchange-traded funds saw an influx of 487 tons in November and 475 tons in December already.
For reference, about 78% of the London Bullion Market Association’s (LBMA) vault silver is now tied up in exchange-traded products, up from 65% in late 2024. Global ETF holdings stood at 1.13 billion ounces recently, still 7% below the prior peak of 1.21 billion ounces in early 2021.
Multi-Year Supply Deficit
The imbalance between available supply and sustained demand has led to five straight years of a supply shortfall. The 2025 deficit is expected to hit 125 million ounces, bringing the cumulative supply gap to 800 million ounces since 2021. This supply strain is hampered by lackluster mine production and recycling, which have been largely flat for over a decade.
Tight Physical Inventories
Perhaps nowhere is this supply dearth more readily apparent than at the world’s largest bullion reserves. Earlier this year, the LBMA vaults struggled to keep pace with surging demand, leading to a 39-times spike in borrowing costs.
Sprott analysts note that free-trading inventory has shrunk to the point where modest demand increases create price convexity, meaning prices jump faster than normal in response to supply shortages.
Macro Drivers Supporting the Rally
Federal Reserve Policy Rate Expectations
The Federal Reserve’s dovish stance on the economy is paying dividends for silver’s performance. Historically, precious metals generate heightened demand during periods of quantitative easing as the opportunity cost of owning non-yielding assets diminishes.
This phenomenon played out in real time this week as silver prices leapt on the news of another Fed rate cut. The central bank is expected to make two more cuts in 2026, suggesting further tailwinds for silver.
Strategic Stockpiling
Another pillar of silver’s strong foundation is strategic stockpiling and an aggressive posture around the globe. Recently, President Trump added silver to the U.S. critical minerals list, indicating strategic protection and policy alignment in the future.
At the same time, some central banks — most notably Russia and China — appear to be diversifying portions of their physical reserves into silver, which supports long-term de-dollarization efforts. Beijing even plans to implement silver export controls in 2026, adding further pressure to global supplies given its leading role in silver production.
A Technical Breakout 50 Years in the Making
All of these forces are unfolding at the same time that silver is completing one of the most important technical patterns in its modern history. For the past five decades, silver has been forming a cup and handle pattern. The shiny metal’s current breakout above $60/oz is the culmination of this half-century build-up.
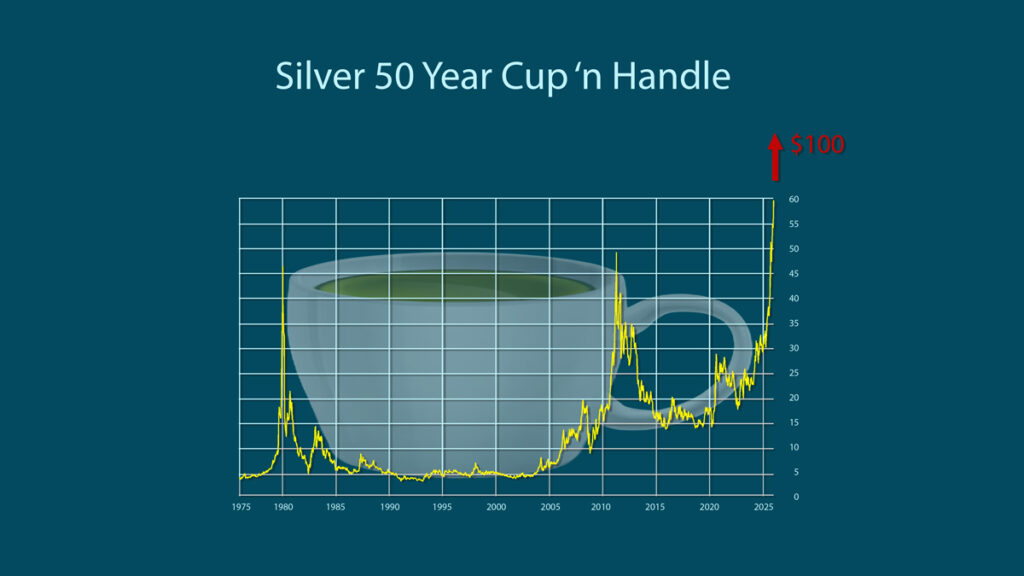
50 year silver cup and handle chart pattern
Now, silver has officially entered price discovery mode, with no historical price ceilings in the way. At this point, $100/oz silver is on the table. With market pressure still intensifying, the move to this next threshold may unfold sooner than many investors expect.
This 50-year cup-and-handle formation is so, so bullish.–