
Eric Sepanek
SBC Founder
Eric Sepanek is the founder of Scottsdale Bullion & Coin, established in 2011. With extensive experience in the precious metals industry, he is dedicated to educating Americans on the wealth preservation power of gold and silver.
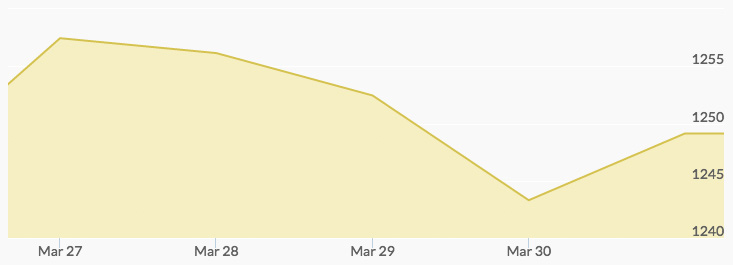
Gold prices saw a solid start of $1,257.82 on Monday. Selling caused the yellow metal to open just three cents below the Monday price at $1,257.79 on Tuesday. The cycle continued into Wednesday morning, when the spot gold price chart reported $1,253.33 following a dip during after-hours trading. A narrow range of light trading kept gold prices just pennies apart, generating a close of $1,253.71, a high for the day. Thursday’s opening below the important $1,250 mark gave warning of the selling that was to come, which created steady downward pressure until a close of $1,243.58. Gold buyers came back on Friday, with the spot price of gold opening at $1,244.76 and closing up at $1,249.34.

The soft performance at the end of the week was blamed on profit taking in the face of a recovering U.S. dollar. This bump was due to positive news in government economic reports on the GDP. The equities market also began rebounding from a multi-day decline by midweek, and the market saw light volume as traders worked to sort out the bounces in the different indicators. 1
A major factor in the late-week selling was the fact that this is the end of the month and quarter for institutions. This time makes it important to lock in profits earned thus far in the year, and many traders dismissed the selling as more bookkeeping than market trend.
The U.S. economic data released Friday on personal income and outlays had yet to be digested, and some see the data as potentially bullish for next week’s trades. This is due to the decline in the University of Michigan March Consumer Confidence Index and increased inflation predictions.