Eric Sepanek
SBC Founder
Eric Sepanek is the founder of Scottsdale Bullion & Coin, established in 2011. With extensive experience in the precious metals industry, he is dedicated to educating Americans on the wealth preservation power of gold and silver.
Gold’s status as a safe-haven asset, preserving value amid broad market downturns, is well-established. However, the yellow metal’s historical performance makes an equally compelling argument as a growth asset.
Since the abandonment of the gold standard in 1971, gold prices have stayed ahead of inflation and the money supply, while yielding more gains than the stock market. This dual role as a barrier against inflation and a high-performing asset expands many investors’ understanding of gold’s traditional role in a portfolio.
Gold as a “Superior Inflation Hedge”
Celebrated economist Mark Skousen has described gold as a “superior inflation hedge,” pointing to the metal’s ability to preserve purchasing power when prices rise. While this is often cited as gold’s most familiar role, the data shows its impact goes beyond simple protection. Gold hasn’t just kept pace with inflation; it has consistently outperformed it.
Over the past 54 years, gold has surpassed both the Consumer Price Index (CPI), the benchmark for household living costs, and M3 money supply growth, which tracks the dollars circulating in the economy and helps reveal underlying inflation pressures.
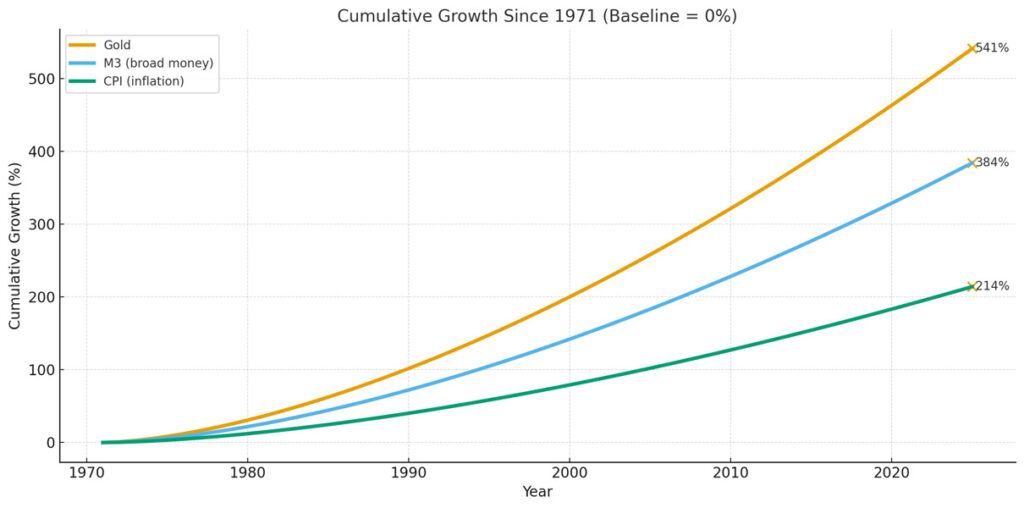
Cumulative Growth:
- Gold: +541%
- CPI: +214%
- M3: +384%
Annual Average Growth
- Gold: 10%
- CPI: 4%
- M3: 7%
Single-Year Maximums
- Gold: +92%
- CPI: +14%
- M3: +29%
Gold’s ability to grow faster than CPI and M3 underscores its dual role as a hedge and a long-term generator of real returns.
Gold as a Top Performer
Traditionally, gold hasn’t been framed as a growth asset, but its price performance over the past five decades begs to differ.
Before 1971, the yellow metal’s price was fixed at $35/oz. When gold was unshackled from this artificial pricing, it exploded to the upside. That meteoric price discovery has continued to this day, with gold hitting its latest record of $3,643/oz on September 9, 2025.
When stacked up against the entire economy and the S&P 500, often considered the country’s chief growth engine, gold is the clear winner.
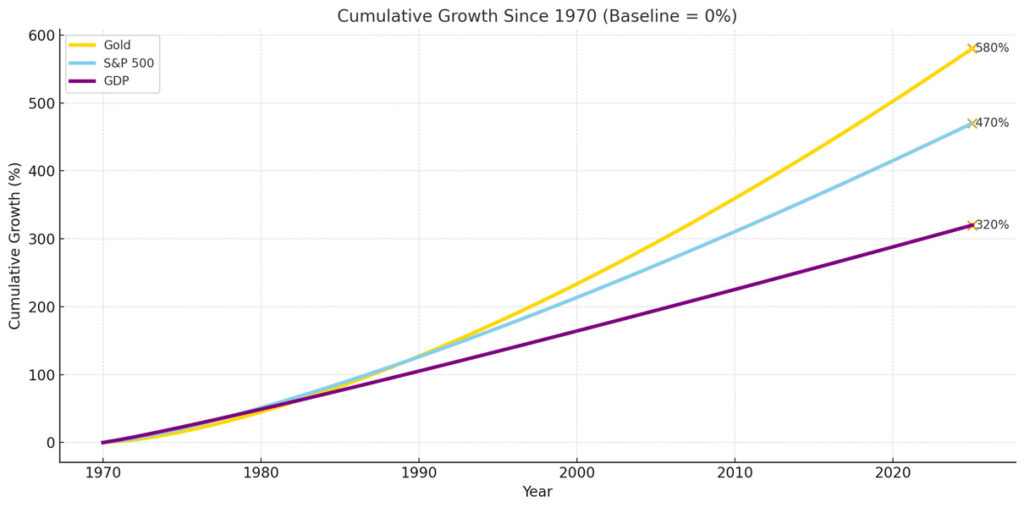
Cumulative Growth
- Gold: +580%
- S&P 500: +470%
- GDP: +320%
Annual Average Growth
- Gold: 10%
- S&P 500: 9%
- GDP: 6%
Single-Year Maximums
- Gold: +92%
- S&P 500: +45%
- GDP: +14%
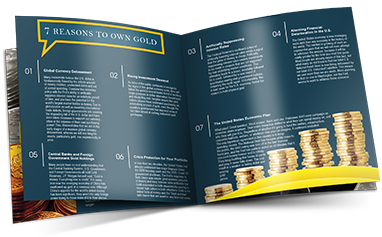
Everything you need to know to get started in Precious Metals
Learn how precious metals can strengthen your portfolio, protect your assets and leverage inflation.
Request the Free GuideSilver’s Silent Strength
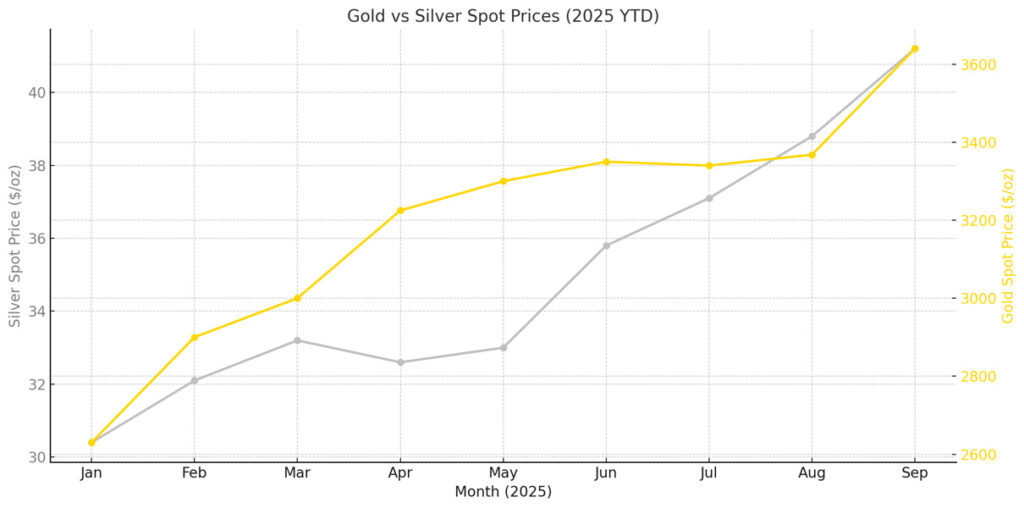
Gold’s larger market size and total demand often overshadow silver. Yet, lining up their performance side by side reveals the shiny metal’s comparable strength.
The poor man’s gold might be slower off the starting block than its larger cousin, but it often makes up for it with more explosive runs. Since the beginning of the year, gold and silver have posted double-digit gains, even after suffering major setbacks in the aftermath of Trump’s Liberation Day tariff shock.
Similar to gold’s double-duty as a wealth preserver and high-performing asset, silver enjoys a dual role as a safe-haven investment asset and an industrial metal. The resulting consistent demand underpins its resilience across shifting market conditions.