
Eric Sepanek
SBC Founder
Eric Sepanek is the founder of Scottsdale Bullion & Coin, established in 2011. With extensive experience in the precious metals industry, he is dedicated to educating Americans on the wealth preservation power of gold and silver.

In the wake of economic shocks, physical gold has reliably outperformed stocks. A recent analysis by TD Securities shows the yellow metal strongly outpaces both the S&P 500 and gold equities at every time frame for an entire year following a serious market downturn.
These findings have serious implications for investors considering where to place their wealth for optimal protection as economic uncertainty peaks and geopolitical tensions rise.
The Analysis: Gold vs Gold Equities vs S&P 500
With the risk of recession looming and market volatility rising, investors are actively searching for the best safe-haven asset to protect their wealth. TD Securities might have stumbled upon an answer to this pressing question by comparing how gold, gold equities, and the S&P 500 perform following severe market disruptions.
The Canadian bank analyzed the average performance of these three assets over multiple time frames in the year following a major economic shock. Here’s what the analysts found:
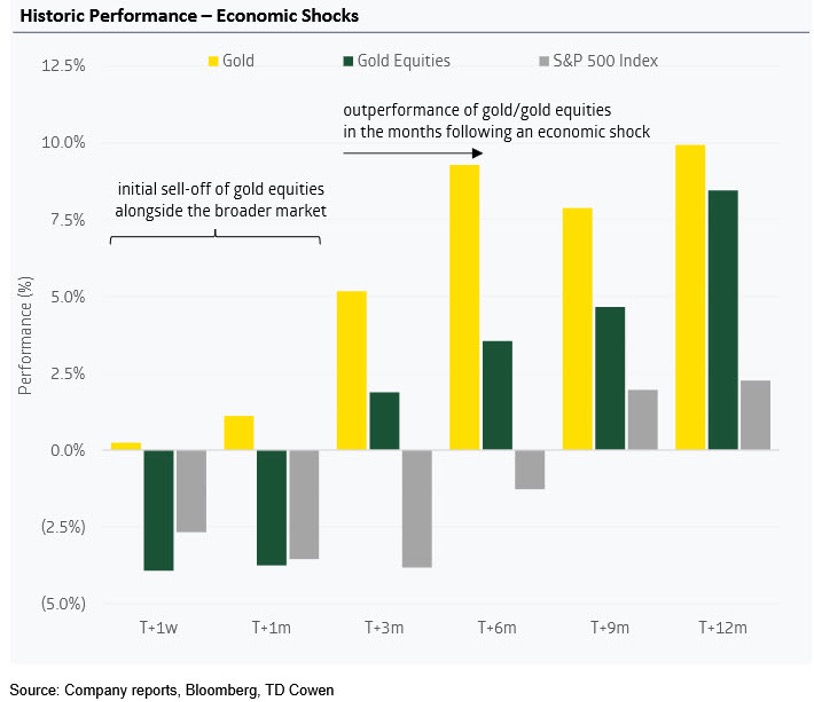
1 Week – 1 Month
- Gold: Holds steady in the immediate aftermath and begins a modest recovery within the first month as safe-haven demand picks up.
- Gold Equities: Suffer steep losses alongside the broader market, but show early signs of stabilizing by the end of the month.
- S&P 500: Experiences a sharp decline and remains underwater, weighed down by uncertainty and investor caution.
3 – 6 Months
- Gold: Gains momentum and clearly outperforms other assets, cementing its role as a top-performing safe haven.
- Gold Equities: Recover into positive territory, buoyed by rising gold prices and improving investor confidence.
- S&P 500: Continues to lag, with performance generally flat or negative as market volatility persists.
9 – 12 Months
- Gold: Delivers the highest total return over the year, maintaining strong upward momentum.
- Gold Equities: Finish solidly positive, though still trailing physical gold bullion.
- S&P 500: Posts a mild recovery and enters positive territory but remains the weakest performer by far, reflecting longer-term economic drag.
👉 Related Read: Gold vs Stock Market: Comparing These Popular Investment Options
Physical vs Paper Gold Performance
TD analysts found gold equities consistently underperform their physical counterparts after financial crises, yet still beat out the broader market. Paper gold, such as exchange-traded funds (ETFs), mutual funds, or gold mining stocks, often suffers sharp declines during stock market sell-offs because of strong ties to traditional assets.
While these paper instruments may follow gold prices, they carry counterparty risk and tend to respond to inflation much like regular stocks. However, the study found gold equities often experience an upside correction around one month after an economic shock and continue yielding outsized returns for a year.
Gold is the Winner…Again
These historical trends revealed by TD’s analysis are playing out in real time as today’s trade war rattles global markets. Since the beginning of 2025, gold has surged 19%, while the S&P 500 has dropped more than 12% and the Dow Jones is down roughly 10% year to date. Once again, the yellow metal is the clear winner in the heat of economic turmoil.
Although prices have continued charting new records, experts keep raising their 2025 gold predictions. This suggests investors aren’t too late to the rally. In fact, a growing number of analysts believe $4,000 an ounce is possible within the year or shortly thereafter.