
Eric Sepanek
SBC Founder
Eric Sepanek is the founder of Scottsdale Bullion & Coin, established in 2011. With extensive experience in the precious metals industry, he is dedicated to educating Americans on the wealth preservation power of gold and silver.

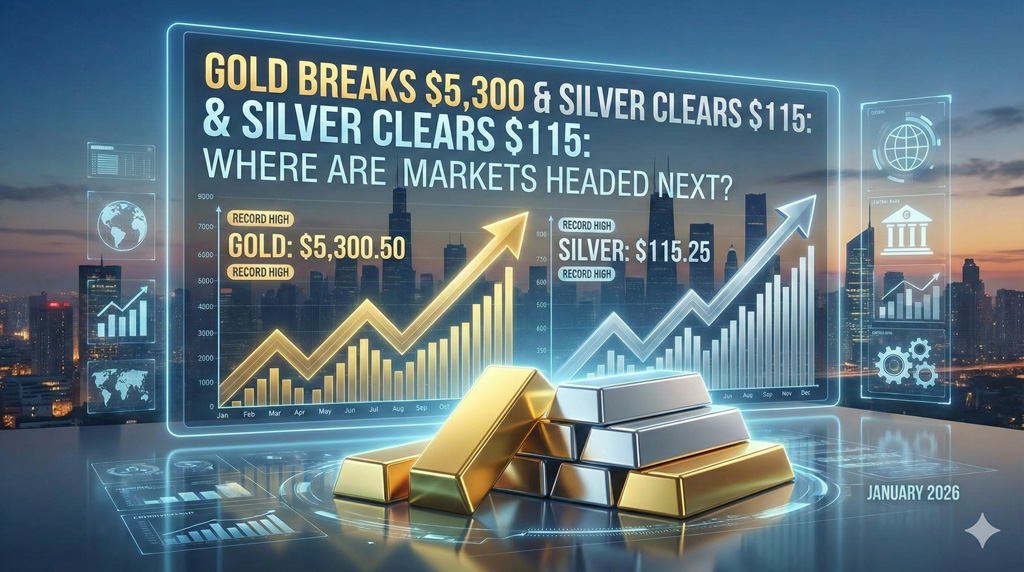 Gold crossed $5,300/oz, and silver broke through $115/oz — both within the first month of 2026. These record-high prices follow on the back of an unprecedented precious metals rally in 2025.
In the midst of these price surges, many investors wonder what’s fueling the surges and whether gold and silver have the momentum to continue their upward trend.
Gold’s Structural Demand Architecture
The yellow metal was catapulted into 2026 at $4,318/oz following a year’s long bull market. With gold prices already reaching $5,300/oz — a more than 22% spike — it’s clear the foundational drivers remain in play.
Central Bank Purchases Top 1,000 Tons
For years, analysts have pointed to central bank demand as the primary catalyst for gold’s strength, and this central theme hasn’t shifted. Final numbers are still under review, but estimates place official consumption for 2025 over 1,000 tons, marking the fourth year at these elevated levels. This historically heightened pace of accumulation is predicted to remain at 60 tons per month, far above pre-2022 levels.
Institutional & Retail Buying Spikes
Institutional investors, family offices, and private wealth managers are also increasing physical gold holdings. In 2025, global gold exchange-traded fund holdings reached a new all-time high of approximately 4,025 tonnes, up roughly 800 tonnes worldwide. This surge was driven by the largest annual inflows on record, totaling around US$89 billion, with North American funds accounting for the majority of these inflows.
Silver’s Structural Leverage Engine
Not to be outdone, silver has skyrocketed by 60% within the first month of 2026, rising from $71.59/oz to $115/oz. For perspective, the shiny metal stood around $28/oz at the beginning of 2025. Similar to prior precious metals rushes, silver prices move later than gold’s but end up yielding higher returns.
Industrial Demand Meets Physical Tightness
Silver is being squeezed as dominant industrial demand increases and physical shortages persist. Rapid expansion in electrification, solar power, energy infrastructure, and digital systems has structurally increased silver intensity across the global economy. Roughly 60% of total silver demand now comes from industrial uses.
On the supply side, silver remains structurally constrained. Approximately 70% of global silver production is generated as a by-product of other metals such as copper, zinc, and lead, which severely limits the industry’s ability to respond to rising demand through direct production expansion.
Financial Flows Rise
Capital flows are now reinforcing these physical pressures. Silver ETFs and related instruments are seeing record trading volumes, reflecting accelerating investor participation. This includes a single-day turnover of $32 billion in iShares Silver Trust (SLV), making it the highest-traded security globally on that day.
The Twin Macroeconomic Engine
Domestic Fiscal Fragility
The U.S. financial reputation has taken a massive hit due to a decades-long commitment to fiscal irresponsibility and a litany of unforced policy errors. The national debt is ballooning as interest payments become one of the largest federal budget items. Yet, overspending remains a bipartisan issue.
All leading credit rating agencies have knocked the U.S. from its long-held perfect credit score. Amid this domestic economic shock, more institutional voices are bailing on the traditional 60/40 portfolio split, encouraging people to diversify with more gold.
Geopolitical Fragmentation
Global markets, trade organizations, and even long-standing defense alliances remain in constant flux. On an economic level, these geopolitical disruptions represent shifting capital flows, fiat currency distrust, and increased safe-haven interest.
The chaos is giving birth to a multipolar world order for which gold is becoming a de facto economic foundation. The yellow metal recently overtook the euro as the second most widely held reserve asset. Furthermore, gold’s total value in central bank reserves now exceeds U.S. Treasuries for the first time in decades
Dollar Weakness
Undisciplined fiscal policy, soaring sovereign debt, and an openly hostile economic posture have pushed the dollar to a four-year low. Since the opening salvo of the Trump admin’s trade war, the U.S. Dollar Index has fallen by 10%, highlighting the dollar’s weakness against other currencies
This fragility has been reflected by a global de-dollarization trend, as foreign countries seek to reduce their economic dependence on the USD.
Rapidly Compressing Gold-to-Silver Ratio
The gold-to-silver ratio, which measures how many ounces of silver equate to an ounce of gold, has shifted sharply. In early 2025, the ratio reached a relatively high of above 120:1, signaling an extreme historical dislocation between gold and silver valuations.
This distortion was one of many indicators suggesting a potential silver rally, which came to fruition in late 2025. With gold near $5,300/oz and silver around $115/oz, the ratio now sits near 45:1.
This scale of compression is historically significant. Rapid declines in the ratio typically occur when monetary demand for gold rises at the same time industrial and investment demand for silver accelerates.
Price Projections Remain Bullish
With precious metals prices hitting new records at a relentless pace, many investors wonder what the future holds. Similar to 2025, every new peak only elicits more optimistic expectations among experts. Gold and silver price projections for 2026 are consistently bullish, as the foundational drivers of both rallies remain active.