
Eric Sepanek
SBC Founder
Eric Sepanek is the founder of Scottsdale Bullion & Coin, established in 2011. With extensive experience in the precious metals industry, he is dedicated to educating Americans on the wealth preservation power of gold and silver.
 Silver has soared over 35% year-to-date, surpassing $39/oz and capitalizing on 2024’s momentum. Sprott, one of the silver market’s leading analysts, sees the rally continuing throughout 2025 and beyond, spurred by structural deficits as multi-source demand outstrips supply for the fifth year in a row.
The green energy revolution is expanding silver’s industrial applications, and revived retail investors are pouring into the poor man’s gold, especially as the yellow metal extends to record levels.
Analysts caution that a “silver squeeze” might be around the corner as silver supply dries up and even moderate buying fuels steep price surges. Silver outperformed gold last year by roughly 5%, and the shiny metal could pull off another upset in 2025.
Silver’s Shiny 2025 Performance
Silver’s performance so far in 2025 has mirrored some well-established patterns that experts look for when citing the potential for explosive growth. Here’s how:
1. Silver’s rally tends to lag behind gold by 12-18 months.
Historically, silver prices pick up speed roughly 12 to 18 months after gold. The yellow metal started breaking out in early to mid-2024, surpassing all-time highs. True to form, silver is playing catch-up a little more than a year later. The lag may have frustrated speculators, but it’s a sign of long-term strength.
2. The shiny metal often outperforms its larger cousin.
Looking back at previous precious metal bull cycles, silver’s returns often clock in twice the size of gold’s. In 2025, silver’s peak-to-trough returns clock in at over 35%, while gold prices have notched a 30% gain.
3. Silver tends to sit idle before a dramatic upward move.
Silver posted an impressive return of 21.46% in 2024, yet the metal eclipsed those gains in the first half of 2025, gaining 24.94% in half the amount of time. If history holds, this could mark just the beginning of a much larger breakout.

The Silver Rally’s 3 Main Catalysts
Sprott analysts highlight three market-specific variables spurring the shiny metal’s booming growth:
5-Year Supply Shortfall
The global silver supply has failed to keep up with total consumption since 2021, and 2025 is on pace to mark the fifth year of supply shortfalls. The cumulative deficit over the past half-decade is nearly 800 million ounces.
While sharp upticks in industrial and investment demand are partially responsible, the supply side of the equation is also struggling. Mining output, which provides the majority of physical silver, has contracted by 7% since 2016.
Expanding Industrial Consumption
Industrial applications account for nearly 60% of total silver consumption, giving these sectors an outsized influence on price action. Across the board, industrial purchases rose by 7% in 2024, reaching a new high of over 700 million ounces–a trend that’s expected to continue in 2025.
The global push for electrification is a major boon to silver demand, especially in the form of electric vehicles, electronics, and solar power. Alone, solar power is expected to comprise 100% of the silver supply by 2050. Right now, solar panels account for 17% of silver consumption.
Renewed Retail Interest
With an economy plagued by policy uncertainty, frayed trade relations, geopolitical instability, and fiscal irresponsibility, investors are increasingly turning to safe-haven assets for protection and privacy. As gold remains near record levels, silver’s comparative affordability is generating fresh hype.
Sprott describes retail interest as the “wild card for the silver market balance,” with the potential to tip the market toward further supply-demand dislocation. The increased availability and accessibility of silver exchange-traded products have facilitated a surge in retail buying. In fact, a whopping 95 million ounces of silver poured into ETPs in the first half of 2025.
Stretched Gold-to-Silver Ratio Signals “Squeeze”
The gold-to-silver ratio has contracted significantly from recent highs of 100:1 as gold prices hover near record levels and silver prices spike. Yet, the current proportion of around 90:1 remains significantly above historical averages of 67:1.
Assuming the yellow metal holds its ground, silver would have to climb 34% before settling at these long-term norms. That would take the metal to roughly $50/oz.
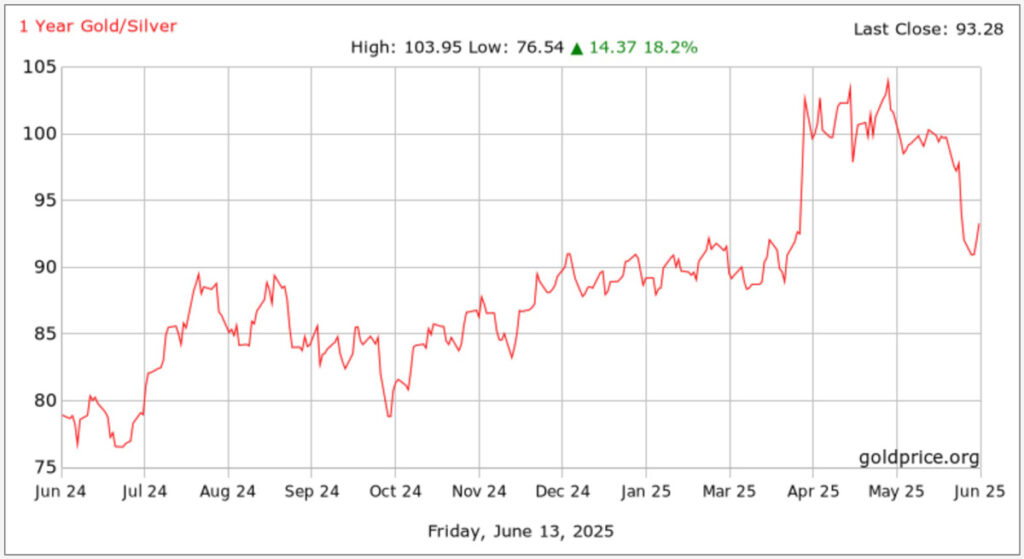
1 Year Gold Silver Ratio History. Source: goldprice.org
Although Sprott holds a 2025 silver price target of $40, which the metal is already nearing, the company’s CEO has much higher aspirations. Eric Sprott predicts “silver is going to skyrocket” and states “the ultimate target is $250.”