
Eric Sepanek
SBC Founder
Eric Sepanek is the founder of Scottsdale Bullion & Coin, established in 2011. With extensive experience in the precious metals industry, he is dedicated to educating Americans on the wealth preservation power of gold and silver.
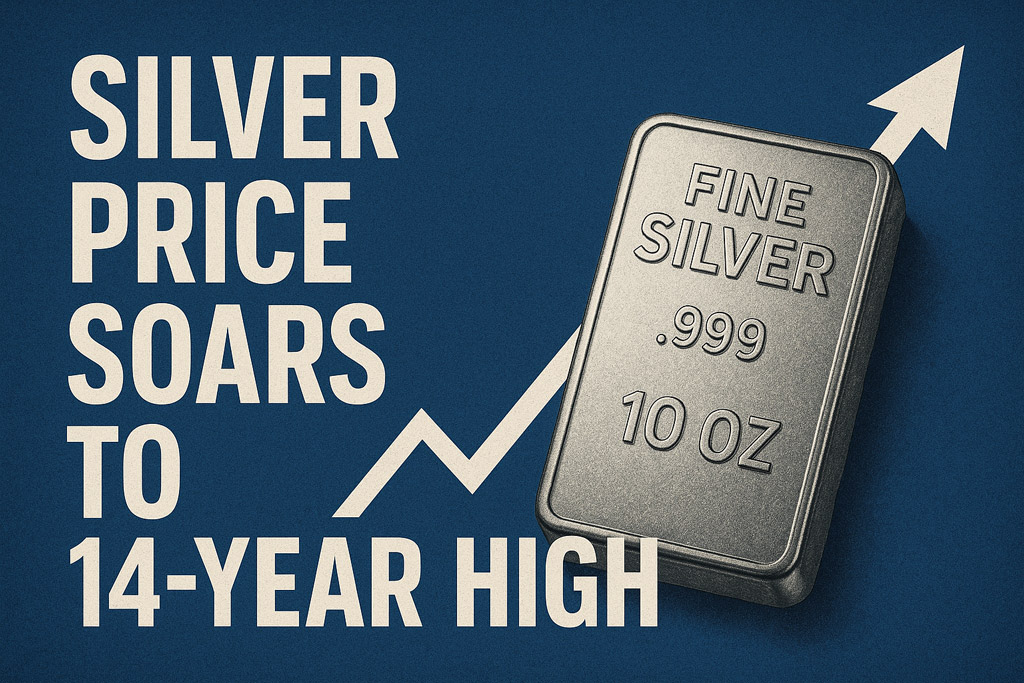 Silver just cleared a major milestone, hitting its highest level since 2011 and signaling renewed strength in the market. The move comes as investors seek safety amid economic uncertainty, inflation fears, and geopolitical tension. While gold has dominated headlines, silver is quietly building momentum of its own, breaking through a key resistance level that held it back for over a decade. With bullish signals piling up, many see this as the start of a long-awaited breakout.
The Shiny Metal Shatters Barrier
Even in the shadow of gold’s record-shattering rally, silver has held its own with a significant 24% gain. On June 5, the shiny metal broke through a 14-year resistance level after crossing $35. Silver climbed to a peak of $36 on the same day, capitalizing on its relative highs. This brings the metal’s year-to-date gains to nearly 25%.
The $35 barrier was last shattered in 2011, and silver has only crossed this price point three times in its long history. Last time, crossing this hurdle triggered a 36% surge in prices. If silver followed the same pattern today, it would climb past $47, stretching the metal’s yield to over 62%.
Bullish Technical Indicators
The growing confidence around silver’s break above $35 isn’t a coincidence. That level had acted as a stubborn ceiling for years, with sellers consistently stepping in whenever prices approached it since 2011.
Now that silver has finally broken through, several key technical indicators are signaling that higher prices may be just around the corner:
- Higher Moving Averages: Silver prices are steadily rising across various time frames, a classic sign of strength.
- Oversold Conditions: The Relative Strength Index, which tracks buying and selling pressure, indicates the metal is gaining momentum without being overbought.
- Ultimate Oscillator: Another metric of buying pressure clearly shows that bulls are in control, as sellers have taken to the sidelines.
- Price Acceleration: Silver’s 50-day moving average has overtaken its 200-day average, meaning the metal is picking up speed.
Easing Gold-to-Silver Ratio
The gold-to-silver ratio’s contraction reflects the shiny metal’s rising momentum compared to gold. This metric, which tracks how many ounces of gold equate to one ounce of silver, has fallen from a relative high of 105:1 in April to around 95 in June.
This narrowing gap between the value of gold and silver comes as the yellow metal takes a breather following months of vertical movement. The ratio’s average range of 70:1 to 50:1 suggests silver has ample runway ahead.
Watch for Market Volatility
The silver market is no stranger to volatility, even during an upward swing. With significantly fewer buyers than the much larger gold market, even small trades can create outsized price movements.
Even experts with bullish 2025 silver price forecasts caution investors to brace for a little shakiness. However, the overall outlook remains confidently bullish as safe-haven demand grows amid geopolitical and economic uncertainty.
$50 on the Horizon
Experts largely agree that silver’s momentum is building, even if their exact price targets differ. Some point to past patterns, noting that a similar breakout in 2011 led to a surge toward $47.
Benzinga analysts see $40 as the next key level, with $50 not far behind. Peter Spina, author of SilverSeek, projects silver could soar to $50 with a chance to double to $100 in the event of a silver squeeze.