
Tim Murphy
Precious Metals Advisor
Tim Murphy is a Precious Metals Advisor with over 15 years of experience. He started on the New York Commodity Exchange floor before founding his own brokerage firm. Tim joined Scottsdale Bullion & Coin to leverage the small-company feel with national exposure, focusing on personalized, client-first service and fostering long-term relationships.
For every action, there is an equal and opposite reaction.–Isaac Newton
Gold firmed up last week on fears of higher inflation and Russia invading the Ukraine. However, whether Russia actually invades or not, gold and silver are headed sharply higher this year. Inflation continues to rise, with the latest “official” number at 7.5%. Key commodity prices, such as crude oil, are booming. Whether “allowed” by the Fed or not, interest rates are heading higher. And just like the 1970’s, gold and silver prices will rise alongside inflation.
Ultimately, rising interest rates will cause the stock market, real estate market and bond market to crater. Most surprising to me, the public is still not overly concerned. I know this for a fact because the majority of investors I know and talk to are still heavily positioned in stocks and bonds. I am shocked, with inflation now at its highest level since the Truman era, that the general public continues to sit on their hands and stay heavily exposed in these volatile markets.
As per John Williams of Shadow Stats, the real inflation rate is closer to 15%, so the average investor with cash in the bank is now losing well over 10% annually in purchasing power. Why would anyone in their right mind not want to make every effort to preserve their purchasing power any way possible?
The “official” US National Debt now exceeds 30 trillion for the first time. Can it be that this overwhelming number has caused the public to go numb? I can only assume the average investor is not aware that most of the markets are rigged, and that the price of gold and silver has been artificially suppressed for years. And because demand for these precious metals is so strong and supplies are so tight, the price suppression is almost certainly nearing its end.
Is the public aware that Russia owns more in physical gold than dollar reserves?
Do you think Russia might know something and is preparing for a major decline in the US dollar?
The following 15-year gold and silver price charts below paint a picture that is very bullish for both metals.
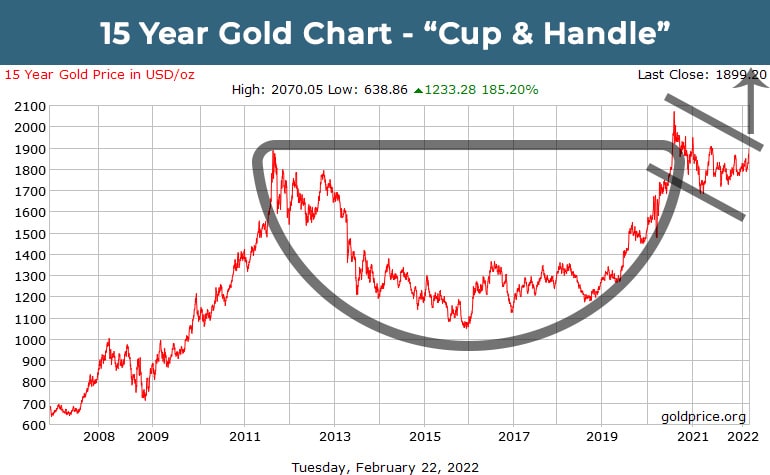
Last week, gold broke free from its massive “cup and handle” formation. If gold can hold its gains this week, it should be off to the races, but regardless of the short term, this chart formation projects a gold price of $2,700 to $3,300 over the next year or two. And, as gold surges, silver will follow in suit and ultimately lead the way, as it has done multiple times in past bull markets.
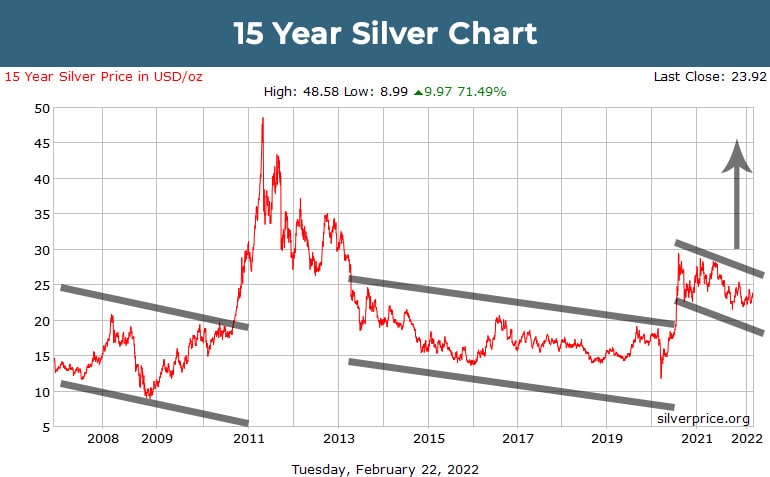
In addition, the silver chart above shows the price at the bottom of a range which means the downside risk at current levels is relatively low. AND, the price of silver can only benefit as demand for solar panels and electric cars rises exponentially. Rarely does a fundamental and technical picture come together so perfectly. And potentially the publics opportunity to take preparation is running out.