
Eric Sepanek
SBC Founder
Eric Sepanek is the founder of Scottsdale Bullion & Coin, established in 2011. With extensive experience in the precious metals industry, he is dedicated to educating Americans on the wealth preservation power of gold and silver.
The London-based World Gold Council (WGC) provides the latest data and analysis in the global gold market. They have offices in New York, Shanghai, Hong Kong, Tokyo, and many other major financial centers around the world. As a highly-respected organization, the WGC consults with governments about gold markets and offers insight and advice to mining companies and major players in the gold industry. Recently, the WGC released its Gold Demand Trends Report for the second quarter of 2014. The report compared gold demand in the second quarter of 2014 to gold demand in the second quarter of 2013. Overall, demand for gold in the second quarter of 2014 dropped to 963.8 tons or 16% below the 1,148.3 tons in the prior year’s second quarter.
Components that Comprise Total Gold Demand
- Gold used to manufacture jewelry
- Gold used in various types of technology
- Gold used to produce bars and coins (investment)
- Net purchases in Gold ETFs
- Net purchases by Central Banks
Jewelry
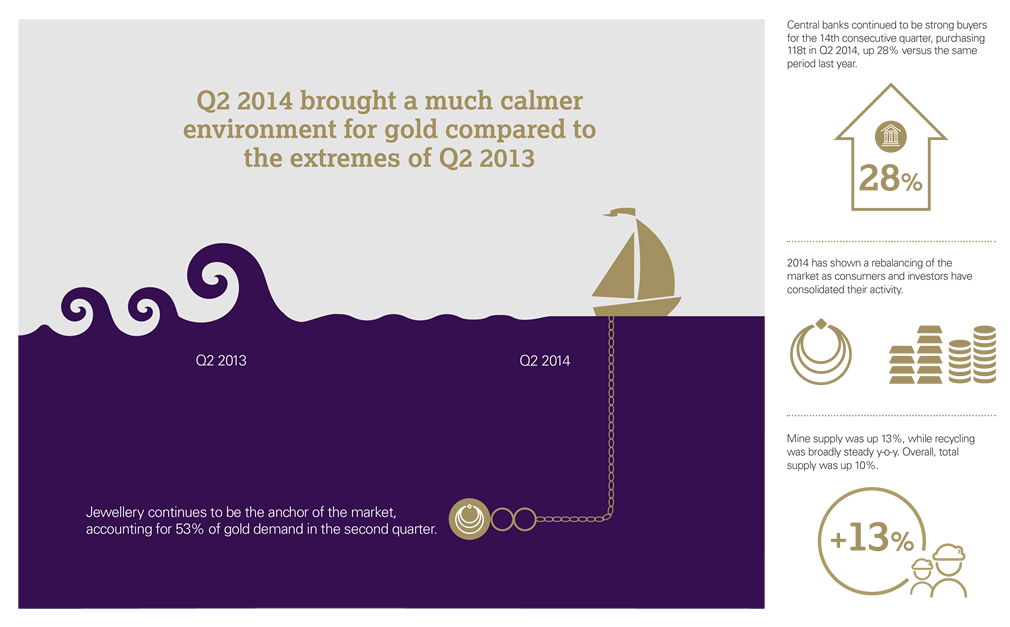
Jewelry demand in the second quarter of 2014 was 509.6 tons as compared to 726.7 tons in the second quarter of 2013. The significant 30% decline was attributed in large part to a decline in buying in China and India.
Technology
Technology demand, which only makes up a small percentage of total gold demand, fell by 3.0% in year-over year comparisons. The technology demand for gold in quarter two of 2014 was 101.0 tons as compared to the 103.8 tons in quarter two of 2013. While growth in semiconductor production was positive for demand, it was offset by weakness in the use of gold in bonding wire, dentistry, and other industrial and decorative uses. Users sought more affordable substitutes such as silver and some base metals.
Investment – Bars and Coins
Gold bar and gold coin demand suffered a major setback in the second quarter of 2014, falling 56% to 275.3 tons from the second quarter 2013 figure of 627.9 tons. The primary reason for the big drop in demand has to do with what took place in the second quarter of 2013. Gold prices dropped by approximately 25% in the second quarter of 2013, spiking demand to levels rarely seen before. Investors added significantly to their holdings and stayed on the sidelines while gold prices moved higher in April, May, and June of 2014. China and India alone accounted for 56% of the drop in gold bar and gold coin demand during the second quarter of 2014.
Investment – Gold ETFs
Net outflows from gold ETFs were only down slightly by 39.9 tons in Q2 of 2014, a big improvement over the 402.2 ton outflow in Q2 of 2013. The data appears to confirm the more balanced approach that institutions and high net worth investors are taking as they ponder the outcome of geopolitical events and the economic outlook for the world.
Central Banks
Gold represents stability and the world’s central banks are, by nature, conservative in their actions. In Q2 of 2014, net purchases of gold by central banks were 117.8 tons, a 28% increase over the 92.1 tons of net purchases in Q2 of 2013. Central banks were in agreement that they had no plans to sell any significant amount of gold and that gold remains, “an important element of global monetary reserves.”
What The Gold Demand Report Tells Us
The WGC report tells us that demand for gold has declined, but it also mentioned that new supply is declining. Essentially, the report suggests that gold prices have reached an equilibrium point – which is why prices have been hovering around the $1,300 mark for the better part of a month. As gold coin investors, you never know when some external event will spike demand. It is always good to be prepared, diversify, and have a portion of your portfolio in precious metals.
Learn how to diversify your portfolio with physical gold. Get our Gold Investment Guide Free! – Click Here