



The Value of Silver

For thousands of years, silver’s natural brilliance has drawn human attention, leading to its use in jewelry, vessels, and trade. Yet, its most enduring legacy lies in its role as a store of value and medium of exchange that helped shape early monetary systems. Long recognized as a precious metal, silver has played a central financial role throughout history, second only to gold.
Since the Industrial Revolution, silver’s expanding and scaled industrial use has added practical economic value alongside its monetary function. Today, investors worldwide continue to view silver as a long-term asset with both financial and real-world relevance.

How Silver is Priced
Unlike gold, whose value is driven primarily by monetary applications, silver’s investment profile is shaped significantly by industrial demand. Some of the fastest-growing and largest sources of modern consumption include electronics, medical technologies, solar energy systems, electric vehicles, and artificial intelligence infrastructure. These practical applications now represent a substantial and growing share of overall demand. In 2025, industrial use accounted for roughly 59% of total global silver consumption, with the solar energy sector alone accounting for nearly 29% of that figure.

Demand for Silver
Gold and silver each play distinct but complementary roles in a well-structured portfolio. Their intrinsic value and long-standing function as stores of wealth give them a unique position among asset classes. As tangible, globally recognized assets, precious metals offer liquidity, durability, and portfolio stability across economic cycles.


Investing in Silver
Drawing on over a century of combined industry experience and proven results, our seasoned and knowledgeable team of precious metals advisors has developed this guide to help investors identify silver products that offer strong fundamentals, sound market positioning, and long-term value within a disciplined precious metals strategy.

Silver Guidance
Silver bullion is valued based on weight and purity, meaning its price reflects the total amount of pure silver in the asset. The London Bullion Market Association (LBMA) — the main trade organization overseeing the global precious metals market — sets the silver price daily, quoted in troy ounces. This medieval unit of measurement was eventually adopted as the official standard metric for precious metals. For reference, one troy ounce is equal to 31.103 grams.
The Historic 2024-2025 Silver Rally
The Market Finally Breaks Free
After years of manipulation and suppression, silver finally experienced the breakout long anticipated by technical analysts. The 2024–2025 move stands as one of the most significant precious metals rallies in modern history — driven not by speculation, but by the convergence of powerful technical breakout signals and fundamental supply-demand dynamics.
What Drove the Rally?

Unlike previous speculative rallies, the 2024–2025 surge was driven by structural factors that aligned closely with the technicals:
1. Five Consecutive Years of Supply Deficits
From 2021 through 2025, global silver markets experienced unprecedented supply deficits totaling over 800 million ounces, equivalent to an entire year of average mine output. The Silver Institute reported that 2024 alone saw a supply deficit of 148.9 million ounces, with 2025 figures remaining deficient by 117.6 million ounces.
At the same time, global silver mine production peaked at about 900 million ounces in 2016 and was approximately 835 million ounces in 2025, indicating a decline of roughly 7.2% over that period.
Unlike gold, approximately 70% to 80% of silver comes as a byproduct of mining other metals such as copper, lead, and zinc. This means silver supply responds to the economics of those base metals rather than to silver’s own price.
2. Explosive Industrial Demand
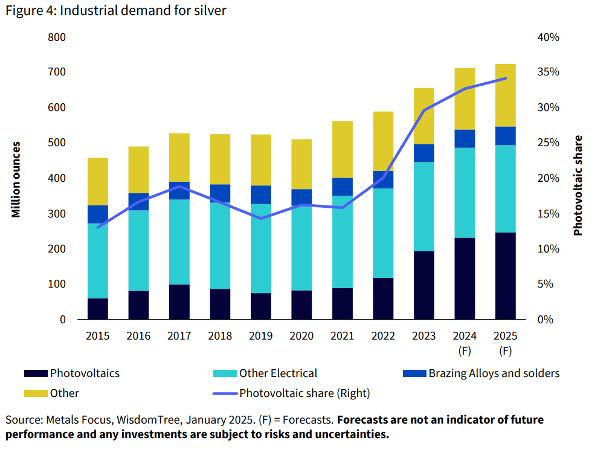
Industrial demand for silver reached a record 680.5 million ounces in 2024, with projections exceeding 700 million ounces in 2025, marking the first time this threshold has been crossed. This represents 59% of total silver demand.


3. Physical Market Stress
The rally was amplified by severe physical market tightness. London’s LBMA vaults, which held 31,023 metric tons of silver in June 2022, had fallen to 22,126 metric tons by March 2025, a decline of nearly one-third. At one point in October 2025, lease rates, the cost to borrow silver, spiked to 200% on an annualized basis, indicating that there was essentially no available metal left in London.
Silver inventories on COMEX and LBMA both drew down significantly through 2024 and 2025. Some traders were forced to transport silver by plane rather than cargo ships to meet delivery demands. This physical squeeze forced a repricing that saw silver outperform gold in percentage terms.
4. U.S. Government Designation as a Critical Mineral
The U.S. government officially designated silver as a “Critical Mineral” in 2025 due to its vital role in advanced technologies and energy infrastructure. This regulatory recognition led to increased funding for domestic silver recycling and more stringent environmental standards for new silver mines, acknowledging that Western solar and electronics supply chains were dangerously exposed to silver shortages.
5. Investment Demand Returns
After years of outflows, silver ETFs saw massive inflows. In the first half of 2025 alone, global silver-backed ETPs experienced net inflows reaching 95 million ounces, pushing global holdings to 1.13 billion ounces, just 7% below their all-time peak. The cost to lease silver rose to its highest levels since 2002, indicating an extraordinary shortage.
India’s silver imports surged sharply in 2024, with 4,554 tons imported in the first half of the year alone, reflecting accelerating retail and investment demand. However, 80% of India’s silver supply is imported, creating additional pressure on already-tight global supplies.
May 2024: The Breakout That Started It All
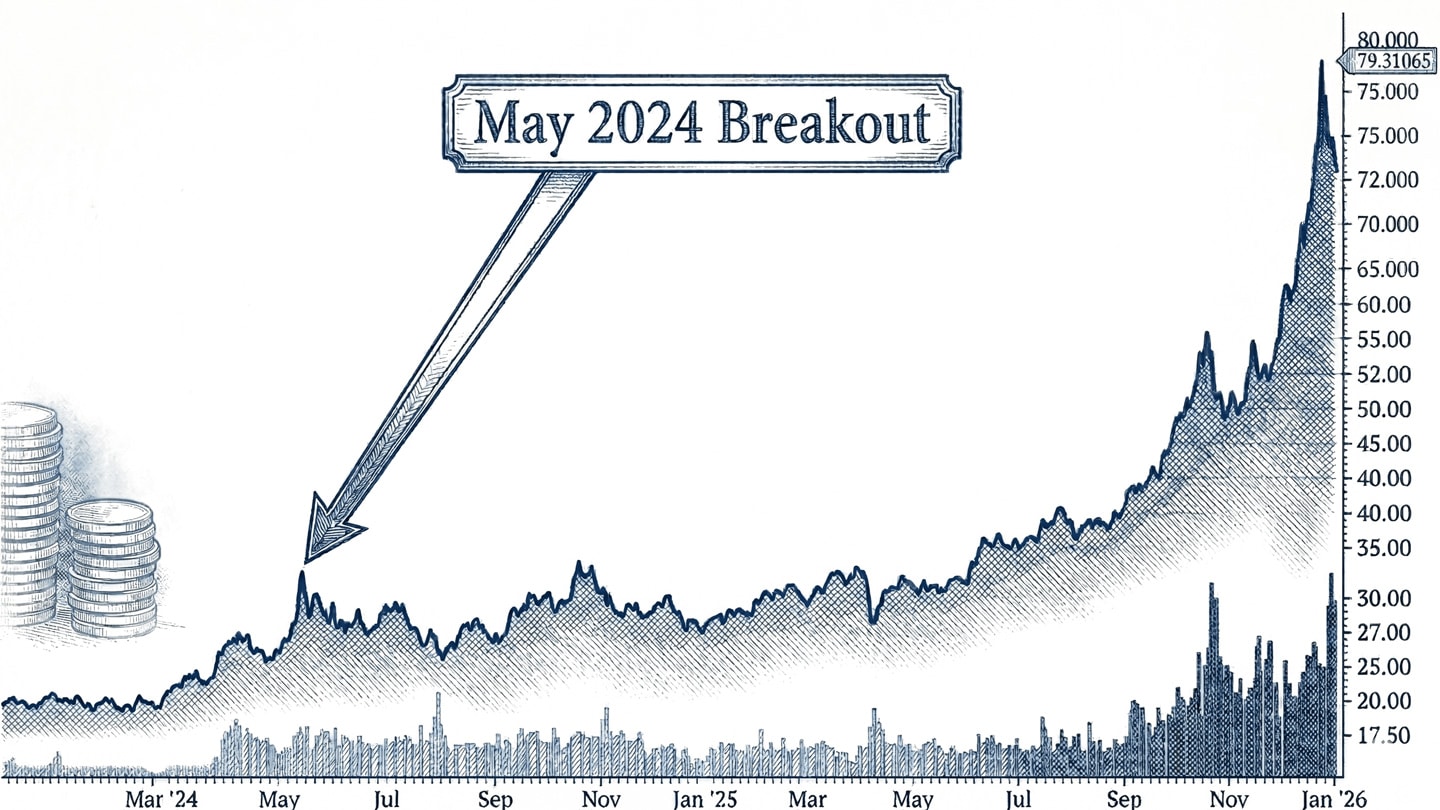
The surge to $32.50 in mid-May 2024 marked the first time silver had traded at those levels since December 2012. This breakout was driven by a tightening physical market that had been largely overlooked by Western paper traders for months. A significant “Shanghai Premium” emerged, with silver on the Shanghai Futures Exchange trading about 9% higher than on COMEX in New York.
This move reflected a powerful convergence of industrial demand, primarily from China’s solar sector, and a deepening global supply crisis that has since redefined silver’s role in the global economy. Unlike the investment-led rallies of 2011, this surge was backed by the physical consumption of metal in green technologies, making the price floor far more resilient than in previous cycles.
Manipulation Finally Loses Control
The 2024–2025 rally demonstrated that even years of documented manipulation cannot suppress fundamental supply-demand economics indefinitely. With cumulative legal settlements exceeding $1.3 billion across eight banks, two JPMorgan traders serving federal prison sentences, and physical inventories at multi-year lows, the forces that had held silver prices down for decades finally lost control.
2008–2016
Sustained manipulation of silver markets through coordinated trading practices and structural price suppression.
2016–2025
Regulatory enforcement and legal accountability, including massive financial penalties and cumulative settlements, culminating in criminal prosecutions.
2023–2025
Federal prison sentences for traders, followed by the 2024–2025 rally, during which silver surged 260%, and new short positions collapsed.
The pattern vindicated the prosecutions and demonstrated that market manipulation, while profitable in the short term, ultimately fails when confronted with structural supply deficits and sustained physical demand.
Bottom Line: Silver Holds Great Potential

It is increasingly clear that precious metals markets have been, and continue to be, subject to manipulation. However, the 2024–2025 rally demonstrates that fundamental economics — supply deficits meeting unprecedented industrial demand — combined with powerful technical breakout patterns, will ultimately prevail over artificial price suppression.
Under current market conditions, silver’s dramatic rise appears firmly supported by both fundamentals and technical structure:
Five consecutive years of supply deficits totaling more than 800 million ounces.
Mine production declining despite higher prices.
Record industrial demand exceeding 680 million ounces annually, growing 3% to 4% per year.
Solar demand alone expected to nearly double between 2020 and 2030.
Official recognition of silver as a critical mineral for national security.
Successful breakout from a multi-year cup and handle technical pattern.
Gold–silver ratio compression from 120:1 to 51:1, signaling continued silver outperformance.
Many analysts believe that as manipulation becomes less effective and increasingly costly due to legal and regulatory consequences, silver will continue to rise in line with its expanding demand base. While current prices sit at all-time highs, they remain structurally justified by persistent supply deficits, the non-discretionary nature of industrial demand, and technical patterns that continue to signal further upside potential. Solar manufacturers, EV producers, and electronics companies cannot easily substitute away from silver; they must secure supply regardless of price in the short term.
Looking ahead, major analysts project continued upward price pressure if current supply deficits and clean energy demand trends persist. Forecasts range from conservative estimates of $120/oz by late 2026 to more aggressive projections of $300/oz by late 2027. The cup and handle structure, combined with underlying fundamentals, suggests that silver’s potential for further long-term price expansion has only begun to unfold.

Silver Rising: Historic to Present Silver Bullion Prices
Silver bullion remains one of the most actively followed commodities today, and its historical context helps explain the forces that pushed prices to historic highs in 2025 and into 2026. For centuries, precious metals have served as a relatively stable hedge against volatility in paper currencies. In today’s uncertain economic environment, precious metals analysts continue to point to silver’s strong long-term growth potential. Examining recent history reveals how complex market dynamics and institutional market forces have shaped silver’s price behavior over time.
Demonetization of Silver in the U.S. Through the 19th Century
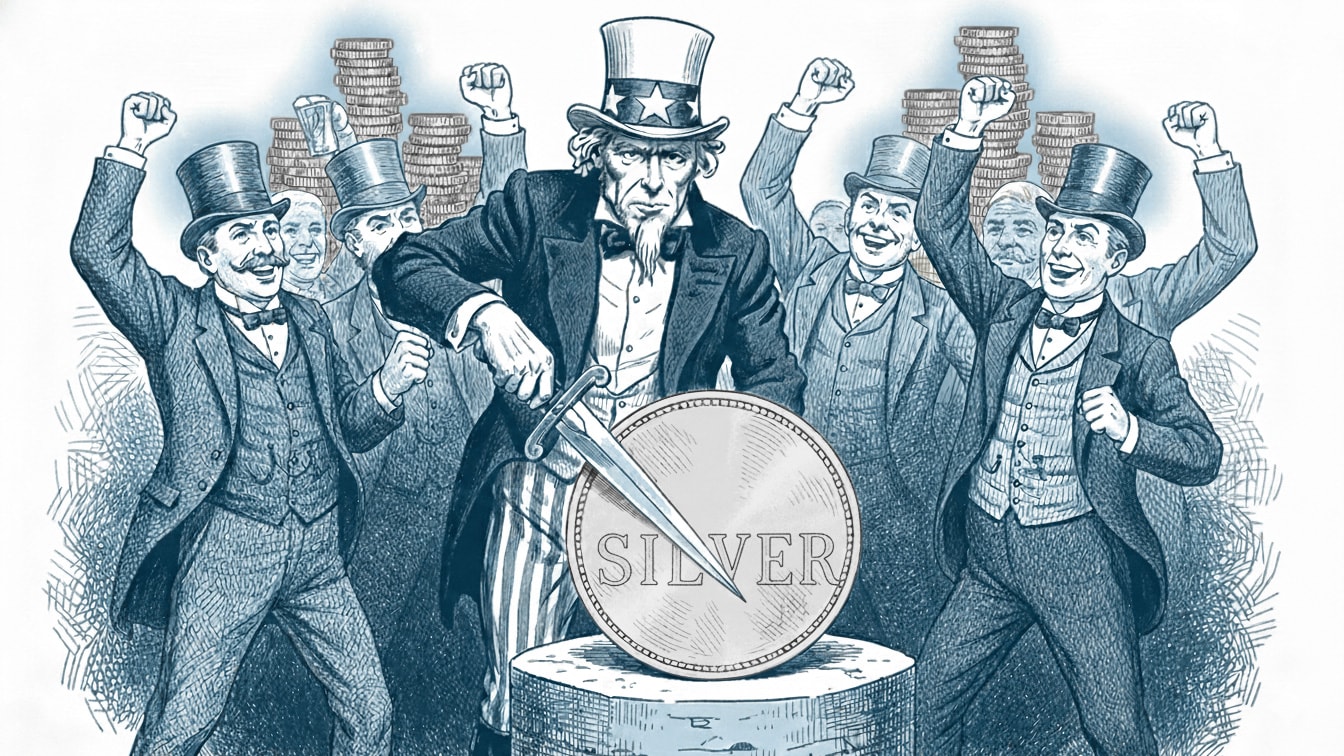
Silver’s path toward historic price highs began in the late 20th century. Before the 1970s, the metal cycled for over a century between demonetization and remonetization, repeatedly losing and regaining its status as legal tender.
This report focuses on pricing history in the United States to ensure consistent historical comparison, while recognizing the market’s central role in silver pricing and investment activity.
In the early U.S. economy, gold and silver were used as legal tender in a bimetallic monetary system, where the federal government periodically fixed their exchange values instead of leaving pricing entirely to market forces.

Starting in 1834, the government adopted a standard silver-to-gold ratio of 16:1, replacing the original 15:1 proportion. Under this system, 16 ounces of silver were legally equivalent to one ounce of gold. In 1873, the government demonetized silver, making gold the sole monetary standard of the nation’s currency.
In the decades that followed, silver’s role as currency remained the subject of ongoing debate and policy experimentation. That trend shifted in 1934, when the Silver Purchase Act authorized the federal government purchase large quantities of silver reserves, backing silver certificates, which reinforced silver’s monetary role. During this period, government policy effectively supported a silver price of $1.29/oz, a structure that remained in place until Congress repealed the program in 1963.
That same year, Congress authorized expanded issuance of Federal Reserve Notes, allowing the government to retire silver certificates. The Coinage Act of 1965 further reduced silver’s role in U.S. currency by removing silver from dimes and quarters and sharply reducing its content in half-dollars due to metal shortages.
Silver’s formal monetary role in the U.S. came to a final close in 1968, when the right to redeem silver certificates for physical silver officially expired. 1964 marked the last year that dimes, quarters, and half-dollars contained any silver. Up until that point, these coins were comprised of 90% silver.
The First Record Jump of Silver Prices in 1979-1980

One of the most infamous events in silver investment history unfolded in the late 1970s and early 1980s. Two wealthy brothers, Nelson and William Hunt — sons of Texas billionaire Haroldson Lafayette Hunt Jr. — attempted to corner the global silver market. In 1979, the price of silver surged from a long-held price of roughly $6/oz to a record high of $48.70/oz, an increase of 712%! At the peak of their accumulation, the brothers were estimated to control nearly one-third of the world’s available silver supply, excluding government-held reserves.
Silver Thursday
On January 7, 1980, in response to the Hunt brothers’ market activity, COMEX — the major U.S. commodities exchange — adopted Silver Rule 7, sharply restricting leverage and limiting purchases on margin. The brothers had relied heavily on borrowed capital to build their silver positions, leaving them exposed to any market reversal. When prices fell, silver dropped more than 50% in just four days, triggering massive margin calls and loan obligations that they were unable to meet. The resulting defaults sparked widespread market panic and became the catalyst for what would become infamously known as “Silver Thursday.”
Silver Reaches Higher Peaks
The Hunt brothers’ actions created a historic boom that shaped investor perceptions for decades. For years, the episode remained a defining reference point in silver market discussions. Some investors believed such a surge would never happen again, while others viewed another peak as inevitable. History would eventually prove the silver bulls correct.
In the aftermath of the collapse, silver prices entered a prolonged period of weakness, trading around or below the $6/oz level throughout much of the 1980s and 1990s, as the metal was increasingly viewed as volatile and speculative rather than a stable monetary asset.
Silver as a Safe Haven in the 21st Century

Silver prices remained subdued throughout the last few decades of the 20th century. The market didn’t start to climb out of the slump until the early 2000s, when the dollar took a dramatic, sustained downward turn and the economy suffered several back-to-back recessions. Between 2002 and 2008, the U.S. Dollar Index (DXY) — which measures the dollar against a basket of foreign currencies — fell by nearly 40%.
The USD’s prolonged downtrend coincided with various bouts of economic challenges, most notably in the midst of the 2001 Dot-Com Bubble and the 2008 Great Financial Crisis (GFC). The dollar’s decrease in purchasing power against foreign currencies was exacerbated by rising trade deficits. The stock market mirrored this economic volatility, shedding nearly half its value following both crises.
As mainstream dollar-backed assets tanked, investors turned to precious metals, such as gold and silver, to hedge their portfolios and protect their wealth. Between October 2007 and March 2008 — the rough duration of the GFC — silver prices soared from roughly $13.50/oz to $21/oz, marking more than a 55% jump.
Unfortunately, silver was unable to maintain this elevated position, near highs not seen in over three decades. By October 2008, the silver market had settled just above $9/oz — a nearly 60% drop. Gold experienced similar surprising losses, even as markets reeled from dollar weakness and economic uncertainty.
These unexpected reversals lead investors to wonder: Why would safe-haven precious metals be losing value during one of the worst financial disasters since the Great Depression? While multiple forces were at play, one behind-the-scenes driver stood out: major financial institutions had clear incentives to limit upward price momentum.
Price Manipulation by Banks

For decades, silver’s repeated failure to achieve sustained breakouts, combined with persistent short-selling by major banks, fueled suspicions of institutional-level market manipulation. Those concerns gained credibility when JPMorgan and HSBC faced legal action and regulatory scrutiny for practices that distorted price formation and undermined market transparency.
At the same time, monetary policy incentives reinforced downward pressure on metals prices, as maintaining confidence in the U.S. dollar remained a priority while rising precious metals prices historically signal currency weakness. Together, these forces worked against sustained upward momentum in metals markets.
Physical Metals Sales Surge
Did this discourage the public from buying physical metals? The market response suggested the opposite. Physical metals firms across the country recorded historic sales volumes. As spot prices fell, premiums above spot began to rise, delivery times stretched into weeks and even months, and investor demand increasingly concentrated in coin products. A clear divergence emerged between paper pricing and physical market reality, with the true cost of acquiring metal decoupling from quoted spot prices.
Silver Skyrockets in 2011
In the fourth quarter of 2010, the Federal Reserve announced plans to purchase $600 billion in long-term U.S. Treasuries in an effort to support economic recovery, launching what became known as Quantitative Easing 2 (QE2). At the same time, rising fiscal uncertainty and the looming threat of a federal government shutdown heightened investor anxiety. Although a shutdown was ultimately avoided, market momentum had already begun to build.
In April 2011, silver surged to $49.51/oz, surpassing the Hunt brothers’ 1980 peak and marking one of the most dramatic rallies in the metal’s history. Physical silver became increasingly difficult to acquire as demand accelerated, and prices reflected a rise of roughly 1,300% over the prior decade.

Precious metals were once again signaling stress in the monetary system. While gold remains the primary barometer of currency confidence, silver also serves as a closely watched indicator of financial stability. At the same time, major financial institutions with significant short exposure to silver faced mounting pressure as prices rose. The next major decline, however, would come nearly as quickly as the boom itself.
Artificial Decline of Silver

Despite strong physical demand, silver entered a prolonged decline over the following years. During this period, major financial institutions became the focus of legal action and regulatory scrutiny for manipulation in precious metals markets. JPMorgan and HSBC faced class action lawsuits alleging market interference, and in September 2020, JPMorgan agreed to pay $920 million to resolve federal investigations into widespread precious metals manipulation involving “spoofing” trades — the placement and rapid cancellation of orders to create artificial price signals. The settlement remains the largest enforcement action in precious metals market history.
Other institutions were also implicated. Deutsche Bank AG agreed to settle U.S. litigation over allegations that it conspired with HSBC Holdings PLC and the Bank of Nova Scotia to influence silver prices at the expense of investors. In a landmark 2023 federal prosecution, two former JPMorgan precious metals traders — Michael Nowak, former head of the bank’s precious metals desk and LBMA board member, and Gregg Smith — were convicted of market manipulation and spoofing, receiving federal prison sentences. These convictions marked the first criminal prison sentences tied to large-scale precious metals market manipulation.
2020: COVID-19

Before the final quarter of 2025, the largest modern surge in public demand for silver bullion occurred during the 2020 COVID-19 pandemic. As global lockdowns spread and economic uncertainty intensified, investors rushed into precious metals. Physical silver bullion disappeared rapidly. In March 2020, the U.S. Mint reported sales of 2.3 million Silver American Eagles in just one and a half weeks, nearly tripling the previous month’s volume. At the same time, bullion dealers across the country faced severe supply constraints, with many products back-ordered for weeks or months, and others unavailable altogether. Something our firm experienced first-hand.
Yet, did the spot price surge alongside physical demand? No. Spot silver initially declined, bottoming at approximately $12.12/oz on March 19, before gradually recovering. Even then, prices never approached $30/oz, remaining far below the 2011 highs. Did buyers acquire physical silver at those depressed prices? Again, no. The physical market diverged sharply from paper pricing. Premiums on silver bullion doubled, tripled, and in some cases quadrupled, creating a significant disconnect between quoted spot prices, ETF valuations, and the true cost of acquiring physical metal.
The WallStreetBets Movement

In early 2021, a segment of the online trading community associated with WallStreetBets, following the GameStop (GME) episode, attempted to drive silver prices higher through coordinated buying of physical silver and silver-linked ETFs. While the so-called “silver squeeze” did not produce a sustained price breakout, it generated significant retail interest and temporarily drove up premiums in the physical silver market.
The episode demonstrated that under certain conditions, retail coordination can challenge concentrated institutional positioning, and it once again highlighted a persistent feature of the silver market: the structural disconnect between paper trading mechanisms and physical supply availability.
https://silverprice.org/silver-price-charts/all-data-silver-price-history-in-us-dollars-per-ounce
Technical Analysis: The Cup and Handle Pattern
Understanding the Cup and Handle Formation
The cup and handle pattern is widely regarded as one of the most reliable formations in technical chart analysis. It develops when price action forms a rounded “U” shape (the cup), followed by a shorter period of consolidation or downward drift (the handle), before breaking out to new highs. This pattern typically forms over extended timeframes, often spanning months or years, and is considered a bullish continuation signal indicating the potential for sustained upward price movement.
In November 2021, technical analysts identified a long-term cup and handle formation in gold price charts that had developed over roughly a decade. At the time, gold was trading near $1,840/oz, following an extended consolidation period despite rising inflation and strong physical demand. When gold broke above the key resistance level at $1,840, the projected measured move from the pattern suggested a long-term price target approaching $3,000/oz.
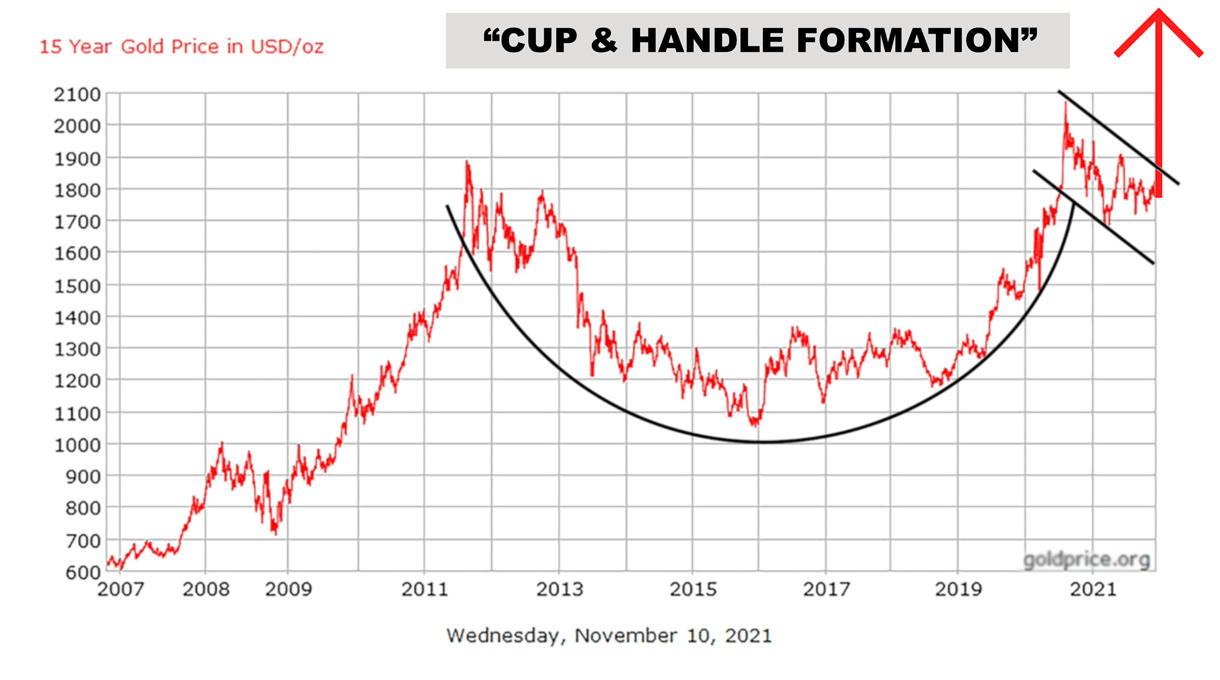
The cup and handle breakout proved remarkably accurate. Following the November 2021 breakout, gold entered a sustained bull market. By 2024–2025, prices not only reached the initial $3,000/oz target but exceeded it significantly, surging past $4,000/oz and reaching as high as $5,600/oz in January 2026. The technical pattern accurately predicted both the direction and the magnitude of gold’s rally.
At the time of the November 2021 breakout, Commitment of Traders data showed that institutional categories such as swap dealers — which include major banks — held substantial net short positions in gold futures, a level of selling pressure that would normally weigh heavily on price. However, gold continued to advance, indicating physical demand and long-term investment flows were exerting a stronger influence than typical paper-market selling.
Silver's Cup and Handle Formation
While gold’s cup and handle pattern broke out in late 2021, silver developed a similar — though delayed — technical formation, forming what amounts to a nearly 50-year cup and handle structure. In fact, it may represent one of the longest cup and handle patterns in market history, with the “cup” forming from 1979 to 2011, followed by a handle-like formation spanning 2020 to 2024. Silver traded largely sideways and remained artificially suppressed through much of 2022–2023, completing its own multi-year cup and handle pattern. The key difference was timing: silver’s breakout came later, but with even more explosive results.
When silver finally broke through its key resistance levels in 2024, the rally proved historic. Opening the year around $23/oz or 24/oz, silver began a measured and persistent climb. The true breakout arrived in 2025, when silver opened at $28.92 and surged 147% to over $70/oz by year-end. In January 2026, silver confirmed these breakout expectations by reaching an all-time high of $121.67/oz.

Why Silver's Pattern Was More Powerful
Several factors made silver’s cup and handle breakout even more significant than gold’s.
Longer Suppression Period
Silver was held down for a much longer period — nearly five decades — and as the old Wall Street saying goes, “The longer the base, the higher in space.” In practical terms, the extended base created greater pent-up demand and a more powerful release once the breakout finally occurred.
Industrial Demand Surge
Unlike gold, which functions primarily as a monetary metal and store of value, silver’s breakout coincided with explosive industrial demand from solar panels, electric vehicles, and AI infrastructure. This created sustained, non-discretionary buying pressure that could not be easily suppressed.
Supply Deficit Crisis
Silver’s five consecutive years of supply deficits (2021–2025), totaling around 800 million ounces, meant that when the technical breakout occurred, there was simply insufficient physical silver to meet demand at suppressed prices. Notably, experts anticipate this structural shortfall to continue.
Smaller Market Size
Silver’s smaller market capitalization compared to gold amplified the move. While gold roughly doubled from its 2021 breakout point, silver increased approximately 300% from its 2021 lows to its January 2026 peak.
The Gold-Silver Ratio Confirms the Technical Pattern
Current Gold-Silver Ratio
65.82
oz of silver
1
oz of gold
The gold-silver ratio — which measures how many ounces of silver are required to purchase one ounce of gold — provides additional confirmation of the cup and handle patterns in both metals. In 2020, the ratio reached an extreme high of over 120:1, meaning it took 120 ounces of silver to buy a single ounce of gold. This level reflected a historic undervaluation of silver relative to gold.
As both metals began their cup and handle breakouts, the ratio started to compress. By January 2026, with gold trading over $5,000/oz and silver over $100/oz, the ratio had tightened to under 50:1. This compression indicates that silver has been significantly outperforming gold in percentage terms — a dynamic technical analysts expect when silver breaks out of a major cup and handle formation.

Historically, gold and silver were fixed at roughly 15:1 in monetary systems, while their natural geological abundance ratio is closer to 17:1. Many technical analysts believe the ratio could eventually compress further to 40:1 or even 30:1, suggesting that silver may still have substantial upside potential even from current elevated price levels.
Structural Price Outlook and Ratio Implications
Silver’s long-term outlook is increasingly shaped by the convergence of technical structure, emerging price support, and shifting gold-silver ratio dynamics.
Breakout Validation (Cup and Handle Resolution)

The measured move from a cup and handle pattern is calculated by adding the depth of the cup to the breakout point. For silver’s multi-year formation, the cup developed from 2011 (peak at $49.51/oz) to 2020 (low near $12/oz), creating a depth of roughly $37/oz. The breakout occurred around $30/oz in 2024, producing a classical measured-move projection of approximately $67oz.
Silver has already nearly doubled this level, rising above $121/oz. This suggests either that the breakout is structurally stronger than the pattern initially projected, driven by extraordinary supply-demand fundamentals, or that silver is resolving into an even larger long-cycle pattern capable of projecting to significantly higher levels.
Formation of a New Price Floor
From a price-structure perspective, silver’s nearly 50-year cup and handle breakout has shifted the market from long-term compression into a structural expansion phase. Rather than defining a single ceiling, the pattern signals a broader repricing process that includes range expansion, price discovery, and the establishment of higher long-term support zones. Technical analysts have pointed to the $50/oz level as a key psychological and structural support area, increasingly viewed as a potential new floor in the post-breakout price structure.
Ratio Compression Signals
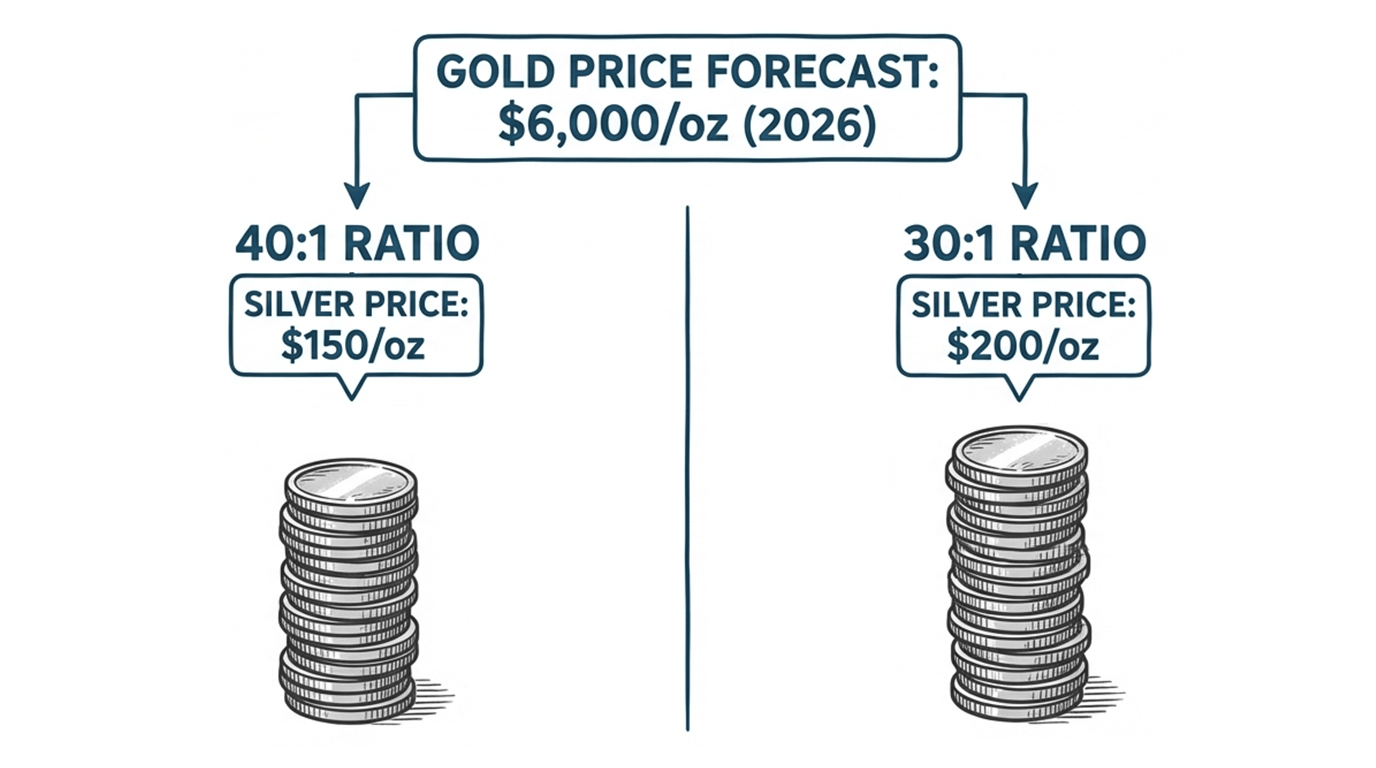
Beyond the pattern itself, relative-value dynamics reinforce the upside case. Many technical analysts expect the gold–silver ratio to continue compressing toward 40:1 or even 30:1. With many analysts now forecasting gold to reach $6,000/oz in 2026, a 40:1 ratio implies silver near $150/oz, while a 30:1 ratio implies silver at almost $200/oz. These are not point forecasts, but ratio-based implications that reflect the relative performance of metals rather than a single, standalone price target.
What This Means for Future Price Targets
Silver price targets remain bullish as a confluence of economic, macroeconomic, and geopolitical factors indicates further upside. Supply chains remain strained as the U.S. and China add silver to their lists of critical minerals, the long-standing supply shortfall continues unabated, and the institutional cap on prices has been lifted. Given these optimistic developments, many technical analysts now project silver could eventually reach $200/oz and $300/oz or higher over the next several years.
Breaking Free from Manipulation
The successful breakouts in both gold and silver represent more than technical chart patterns; they reflect a market breaking free from decades of price suppression. As our precious metals advisors predicted in November 2021..
“The bullion banks will not go down without a fight, but whether gold explodes higher this week, next week, next month, or next year, a much higher gold price is in the cards.”
Tim Murphy
Precious Metals Advisor

That assessment proved prescient. Despite continued attempts at manipulation, the fundamental forces of supply and demand — combined with legal consequences for market misconduct ($1.3+ billion in settlements and federal prison sentences) — have allowed precious metals prices to begin reflecting underlying market realities. The cup and handle pattern served as the technical signal that this breakout was approaching.
For silver investors, the implication is clear: when major technical structures align with strong fundamentals, powerful upward momentum follows — momentum that coordinated market pressure cannot suppress indefinitely. The multi-year cup and handle formation in silver was not merely a chart pattern; it was the market structurally preparing for one of the most significant precious metals breakouts in modern history.
Trade Secrets: How to Get the Most Out of Silver
A Lower-Volatility Strategy for Silver
What if there were a way to invest in silver with less volatility, without sacrificing long-term upside potential? There is a strategy that can potentially do just that. Instead of relying solely on silver bullion coins or bars, investors can also allocate to circulated silver dollars.
Circulated Silver Dollar Strategy
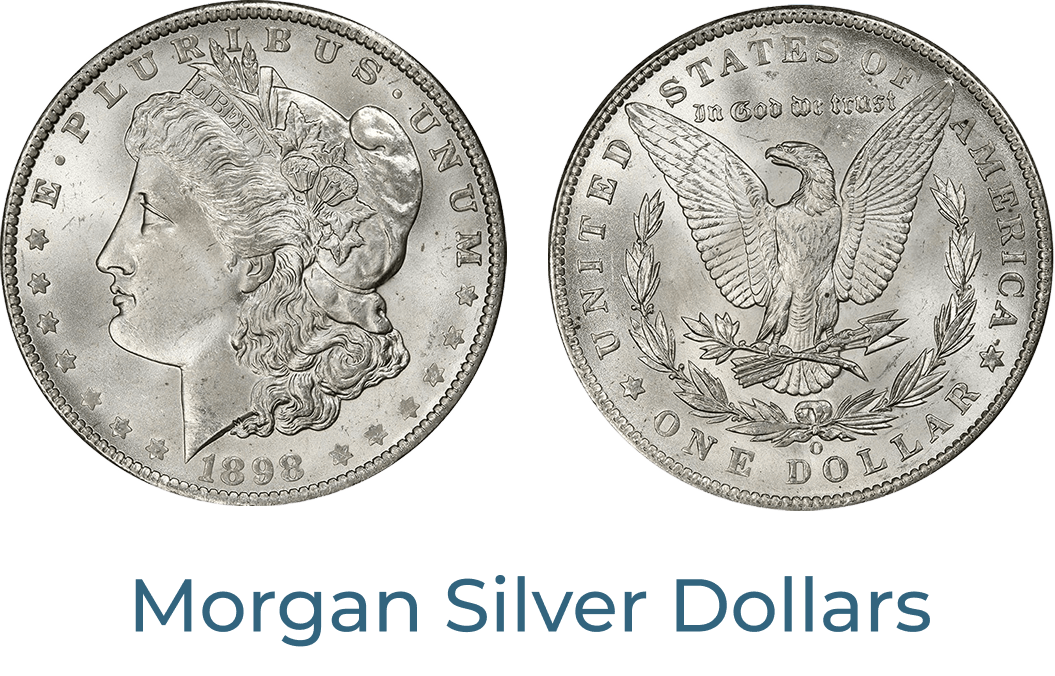

A circulated silver dollar strategy can help reduce downside risk while still retaining meaningful upside exposure when spot silver prices rise. Our primary recommendations within this category are Morgan Silver Dollars and Peace Silver Dollars. Below is an overview of why this approach represents an undervalued, yet structurally strong, silver investment strategy.
The Case for Circulated Silver Dollars
Privacy and Scarcity
Circulated silver dollars offer one of the highest levels of legally obtainable privacy available to precious metals investors. Unlike securities and certain bullion products, the liquidation of circulated silver dollars does not require buyers to collect Social Security numbers or file 1099-B tax reports. Investors remain solely responsible for reporting capital gains.
With no new production, limited supply, and persistent demand, these coins maintain value that is not solely dependent on spot silver prices, giving them structural scarcity advantages.

Privacy
Buyers not required to collect Social Security numbers.
Buyers not required to collect 1099-B tax reports.
Investors solely responsible for reporting capital gains.

Security
No new production.
Limited supply.
Persistent demand.
Understanding Circulated Silver Dollars
Although nearly 657 million Morgan Silver Dollars were originally minted, fewer than 20% are estimated to still exist today. Under the Pittman Act of 1918, the U.S. Mint melted down over 270 million Morgan Silver Dollars. Before 1964, the U.S. Mint produced circulating coinage using 90% silver. Additional millions were destroyed around 1980, when silver prices approached $50/oz.
Morgan Silver Dollar


Weight
26.73 grams
Actual Silver Weight (ASW)
0.7734 troy ounces
Silver Content
90% silver, 10% copper
Morgan Silver Dollars were minted from 1878 to 1904 and again in 1921 using 90% silver.
Peace Silver Dollar


Weight
26.73 grams
Actual Silver Weight (ASW)
0.7734 troy ounces
Silver Content
90% silver, 10% copper
Peace Silver Dollars were minted from 1921 to 1928 and from 1934 to 1935 using 90% silver.
Intrinsic vs. Extrinsic Value: A Critical Distinction

Although circulated silver dollars do not contain a full troy ounce of silver, their premiums typically meet or exceed spot silver prices due to their extrinsic value, meaning the numismatic and collectible premium beyond pure metal content.
During extreme price surges, such as the 2011 silver rally, these coins often trade closer to their intrinsic metal value, as rapidly rising spot prices temporarily overpower the extrinsic premium. This dynamic creates unique buying opportunities during periods of market dislocation.
History shows that once markets stabilize, extrinsic value reasserts itself, adding another layer of long-term value. This dual-value structure is what makes circulated silver dollars fundamentally different from standard bullion.
Superior Value Retention: The Real Advantage
While upside potential matters, the primary advantage of circulated silver dollars is their historically proven resilience during market downturns.
From May 2010 to April 29th, 2011, silver bullion surged 182% as economic instability intensified.

During the same period, Morgan Silver Dollars rose from approximately $24 to $46, a gain of about 92%.

While that gain appeared smaller at the peak, the true advantage emerged during the correction.
The 2011 Crash: A Case Study
Following the 2011 peak, the silver market experienced a brutal multi-year decline. By summer 2015, silver bullion had fallen to $13.65, representing a massive 72% loss from its high.

In comparison, between 2014 and 2018, circulated Morgan dollars held steady at about $29, absorbing nearly four years of a bear market with only a 37% correction.

Why the Difference?
Circulated Morgan and Peace Silver Dollars do not move dollar-for-dollar with bullion because they operate in a fundamentally different market. Their pricing is driven by real supply and demand, not institutional leverage.
Large financial institutions have historically influenced paper silver markets through futures contracts without requiring physical delivery. That same influence has minimal effect on circulated silver dollars, which are held by collectors and long-term investors who tend to buy and hold, creating stable natural demand. It's worth noting that these coins are also measured in a monetary system not based on the troy system that today's London Fix is based on — yet during normal market cycles, they consistently trade at a premium over the current spot price of one troy ounce of silver. Their finite supply keeps them at a slightly elevated value level, almost by default.
That dynamic shifts, however, during a boom. In periods like 2011, and again at the end of 2025 into early 2026, new investors rush into the silver market, driven almost entirely by appetite for intrinsic value. When silver surges fast enough, something unique happens: circulated dollars lose their premium entirely. The buying spree is so broad and indiscriminate that these coins are swept out of circulation alongside everything else, and the numismatic and collector premiums temporarily evaporate.
This creates one of the cleaner buying signals in the silver market. If you find yourself able to purchase a circulated Morgan or Peace dollar at or under the one-ounce spot price, that is a strong opportunity — you are acquiring a historically scarce, dual-market asset at pure melt value.
On the upside, these coins fully participate in silver's appreciation in intrinsic value. On the downside, their scarcity, collector demand, and dual-value structure provide built-in protection that helps preserve capital during market declines — a characteristic bullion alone does not offer.
A Strategy Built on Profit, Privacy, and Protection

For investors seeking profit potential, privacy, and long-term protection, circulated Morgan and Peace Silver Dollars offer a compelling alternative to bullion and ETFs. Their limited supply, legal privacy advantages, dual-value structure, and proven resilience during market cycles make them uniquely positioned for long-term wealth preservation in an increasingly volatile financial environment.
Silver’s Structural Repricing Era
The silver market has entered a new era. The 2024–2025 rally to all-time highs above $120/oz represents not just another price spike, but a fundamental repricing driven by structural supply deficits, unprecedented industrial demand, and the successful breakout from a powerful multi-year cup and handle technical pattern.
For investors, the lessons are clear: major technical patterns validated by strong fundamentals create opportunities that persist for years, not months. Whether through ETFs for short-term trading flexibility, physical bullion to capture maximum upside from continued price appreciation, or circulated Morgan and Peace Silver Dollars for long-term stability with reduced downside risk, the silver market now offers compelling opportunities across multiple investment strategies.
As we move through 2026, with silver trading above $65.79/oz and technical patterns suggesting further upside, experts are placing $200/oz and even $300/oz on the table. At the same time, the opportunity to position within this market remains strong.
The convergence of technical breakout signals, structural supply deficits, accelerating industrial consumption from green energy and technology sectors, and a supportive macroeconomic environment suggests that silver’s 2025 performance may represent the early phase of a broader multi-year bull market rather than its conclusion.
Ready to Build a Silver Strategy That Works for You?
For guidance on building a diversified silver portfolio aligned with your investment goals, risk tolerance, and timeline, connect with your dedicated precious metals advisors at SBC Gold. Each consultation is focused on understanding your financial priorities and developing a strategy that fits your long-term objectives rather than offering generic product recommendations.
Here’s What You’ll Learn in Your Free Consultation

Your investment objectives
Clarify how silver fits into your broader financial strategy, whether for wealth preservation, growth, inflation protection, or diversification.
Risk and time horizon alignment
Understand which silver assets match your comfort level and investment timeline.
Product selection guidance
Learn which options may be appropriate for you, including physical bullion, ETFs, Silver IRAs, and other vehicles.
Portfolio integration
Determine how silver can be responsibly incorporated into your overall financial plan.
Market fundamentals
Gain a clear understanding of silver’s supply-demand dynamics and long-term drivers.
Cost transparency
Review premiums, fees, storage considerations, and how to avoid common overpaying pitfalls.
Actionable strategy
Leave with a clear, practical plan you can implement with confidence.
Consultations are available in person at the Scottsdale office or remotely by phone for your convenience — whichever is most convenient for you.
