Sit back in your favorite chair, pour yourself a glass, and take a retrospective look back to the year that was. There is a day left before 2014 ends and 2015 begins. Even if you have a bad memory, some things happened in 2014 that are hard to forget.
ISIS and Ferguson dominated the headlines. The Seattle Seahawks won the Super Bowl and Russia hosted the Sochi Olympics. Ebola broke out in Guinea and quickly became a global crisis. Malaysian Airlines flight MH370 just disappeared. Russian troops seized Crimea and the civil war in Syria intensified. William and Kate introduced Prince George to the world and comedian Robin Williams committed suicide.
While the stock market soared to new heights and more people found jobs, not everyone participated in the economic recovery. The income gap between the very wealthy and the very poor grew larger and the middle-class struggled. Amid all of the drama and political unrest, gold went on a bumpy ride, and basically ended the year 2014 (at least through mid-December) at about the same price as it started the year ($1,205 on January 1 and $1,196 on December 15).
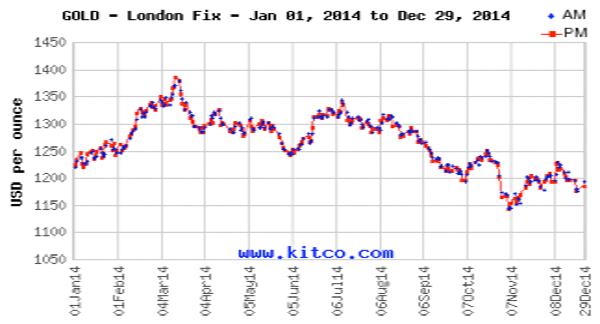
As you can see in the above gold price chart, gold went through a number of ups and downs over the 12-month period. Starting the year at $1,205, the yellow metal moved in a fairly steady upward pattern for the next two and one-half months, reaching a yearly high of $1382 on March 14. Gold buyers ran out of steam and prices retreated below $1,300 in less than a month. For April and most of May, gold stayed right around $1,300 before taking a quick dip just below $1,250. Then, from early June to early July, prices climbed back up to almost $1,350. Gold then entered a sustained weak period over the next four months. It hit its yearly low of $1,151 on November 10. Gold rallied back over the next month, getting back up to $1,230 on December 9 and was last trading at $1,196 on December 15. What happened during each of those periods that affected the price of gold?
January 1 – March 14
Gold prices moved up steadily during this period. Starting at $1,205.46 on January 1, 2014, they climbed to $1,382.84 on March 14, 2014. Gold prices were pushed higher by a combination of political and economic events. Russia invaded Crimea and civil war was raging in Syria. Gold became more of a safe haven. The U.S. economy was not doing very well during the first quarter of 2014. GDP growth was negative at minus 2.1 percent and the unemployment rate1 was hovering between 6.6 and 6.7 percent. Nonfarm payrolls were an anemic 84,000 in January.
March 14 – April 3
Gold prices declined by almost 100 points from $1,382 on March 14 to $1,286 on April 3. Demand for gold during this time started to wane as talk of a rise in interest rates made the precious metal less attractive as a store of value. Higher short-term interest rates place a downward force on gold prices as investors can earn a return on their “safe” money.
April 4 – May 26
Gold traded in a fairly narrow range ($1,284-$1,327) during this time period. While wars were raging around the world and the Fed was continuing to reduce its bond purchases, supply and demand remained relatively unchanged.
May 27 – June 18
Gold prices dropped big-time on May 27. After closing at $1,301 on May 26, prices fell to $1,264 on May 27 and remained under $1,300 through June 18 ($1,277). The $37 one day decline could be attributed in part to lessening tensions in Ukraine, an increase in consumer confidence, and a decrease in Chinese demand for gold.
June 19 – August 15
Gold prices shot up to $1,320 on June 19 after closing at $1,277 on June 18. For the almost two-month time period, gold averaged slightly over $1,300 before dropping below the benchmark to $1,298 on August 18. The big move upward was largely attributed to Fed Chairman Janet Yellen’s comments that interest rates would remain low.
August 18 – November 10
Gold gradually began to decline at a steady pace once it dropped below $1,300 on August 18. It reached a low of $1,151 on November 10. Gold was weak as the Fed ended quantitative easing and the dollar remained very strong against other currencies.
November 11 – December 31
After hitting yearly lows in November, gold went back up over $1,200. Oil prices extended their declines to below $60 per barrel, which had people believing that demand was weak because the world economy was weak. Fear of a major stock market decline had investors seeking a safe haven in gold, and end-of-year selling to lock-in gains exacerbated this sentiment.
Looking back at gold’s performance over the year 2014 can give you a sense of how gold might perform in 2015. Times are uncertain and it is never a bad idea to have a percent of your assets in physical gold.
Additional Sources:
1 – http://data.bls.gov/timeseries/LNS14000000